Make an area plot in Python using Bokeh
Last Updated :
22 Jun, 2020
Bokeh is a Python interactive data visualization. Unlike Matplotlib and Seaborn, Bokeh renders its plots using HTML and JavaScript. It targets modern web browsers for presentation providing elegant, concise construction of novel graphics with high-performance interactivity.
Plotting the Area Plots
Area plots are defined as the filled regions between two series that share a common areas. Bokeh Figure class has two methods which are given below:
1. varea() method: varea() method is a vertical directed area which has one x coordinate array and two y coordinate arrays, y1 and y2, that will be filled between.
Syntax: varea(x, y1, y2, **kwargs)
Parameter:This method accept the following parameters that are described below:
- x: This parameter is the x-coordinates for the points of the area.
- y1: This parameter is the y-coordinates for the points of one side of the area.
- y2: This parameter is the y-coordinates for the points of other side of the area.
Example:
Python3
import numpy as np
from bokeh.plotting import figure, output_file, show
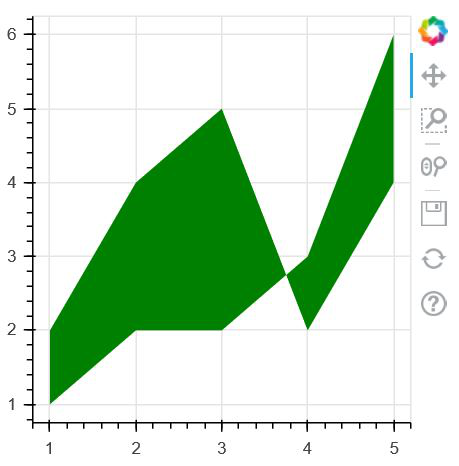
x = [1, 2, 3, 4, 5]
y1 = [2, 4, 5, 2, 4]
y2 = [1, 2, 2, 3, 6]
output_file("geeksforgeeks.html")
p = figure(plot_width=300, plot_height=300)
p.varea(x=x, y1=y1, y2=y2,fill_color="green")
show(p)
|
Output:
2. harea() method: harea() method is a horizontal directed area which has one x coordinate array and two y coordinate arrays, y1 and y2, that will be filled between.
Syntax: harea(x1, x2, y, **kwargs)
Parameter:This method accept the following parameters that are described below:
- x1: This parameter is the x-coordinates for the points of one side of the area.
- x2: This parameter is the x-coordinates for the points of other side of the area.
- y: This parameter is the y-coordinates for the points of the area.
Example:
Python3
import numpy as np
from bokeh.plotting import figure, output_file, show
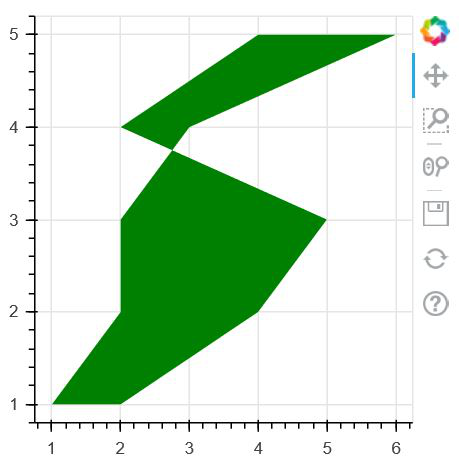
y = [1, 2, 3, 4, 5]
x1 = [2, 4, 5, 2, 4]
x2 = [1, 2, 2, 3, 6]
output_file("geeksforgeeks.html")
p = figure(plot_width=300, plot_height=300)
p.harea(x1=x1, x2=x2, y=y,fill_color="green")
show(p)
|
Output:
Share your thoughts in the comments
Please Login to comment...