The previous statistical approaches (such as central tendency and dispersion) are limited to analysing a single variable or statistical analysis. This type of statistical analysis in which one variable is involved is known as Univariate Distribution. However, there are instances in real-world situations where distributions have two variables like data related to income and expenditure, prices and demand, height and weight, etc. The distribution with two variables is referred to as Bivariate Distribution. It is necessary to uncover relationships between two or more statistical series. Correlation is a statistical technique for determining the relationship between two variables.
What is Correlation?
A statistical tool that helps in the study of the relationship between two variables is known as Correlation. It also helps in understanding the economic behaviour of the variables.
According to L.R. Connor, “If two or more quantities vary in sympathy so that movements in one tend to be accompanied by corresponding movements in others, then they are said to be correlated.”
In the words of Croxton and Cowden, “When the relationship is of a quantitative nature, the appropriate statistical tool for discovering and measuring the relationship and expressing it in a brief formula is known as correlation.”
According to A.M. Tuttle, “Correlation is an analysis of covariation between two or more variables.”
Two Variables are said to be Correlated if:
The two variables are said to be correlated if a change in one causes a corresponding change in the other variable. For example, A change in the price of a commodity leads to a change in the quantity demanded. An increase in employment levels increases the output. When income increases, consumption increases as well.
The degree of correlation between various statistical series is the main subject of analysis in such circumstances.
Correlation and Causation
The degree of correlation between two or more variables can be determined using correlation. However, it does not consider the cause-and-effect relationship between variables. If two variables are correlated, it could be for any of the following reasons:
1. Third-Party Influence:
The influence of a third party can result in a high degree of correlation between the two variables. This analysis does not take into account third-party influence. For example, the correlation between the yield per acre of grain and jute can be of a high degree because both are linked to the amount of rainfall. However, in reality, both these variables do not have any effect on each other.
2. Mutual Dependence (Cause and Effect):
It may be challenging to determine which is the cause, and which is the effect when two variables indicate a high degree of correlation. It is so because they may be having an impact on one another. For example, when there is an increase in the price of a commodity, it increases its demand. Here, the price is the cause, and demand is the effect. However, there is a possibility that the price of the commodity will rise due to increased demand (population growth or other factors). In that case, increased demand is the cause, and the price is the effect.
3. Pure Chance:
It is possible that the correlation between the two variables was obtained by random chance or coincidence alone. This correlation is also known as spurious. Therefore, it is crucial to determine whether there is a possibility of a relationship between the variables under analysis. For example, even if there is no relationship between the two variables (between the income of people in a society and their clothes size), one may see a strong correlation between them.
So, it can be said that correlation provides only a quantitative measure and does not indicates cause and effect relationship between the variables. For that reason, it must be ensured that variables are correctly selected for the correlation analysis.
Significance of Correlation
- It helps determine the degree of correlation between the two variables in a single figure.
- It makes understanding of economic behaviour easier and identifies critical variables that are significant.
- When two variables are correlated, the value of one variable can be estimated using the value of the other. This is performed with the regression coefficients.
- In the business world, correlation helps in taking decisions. The correlation helps in making predictions which helps in reducing uncertainty. It is so because the predictions based on correlation are probably reliable and close to reality.
Types of Correlation
Correlation can be classified based on various categories:
Based on the direction of change in the value of two variables, correlation can be classified as:
1. Positive Correlation:
When two variables move in the same direction; i.e., when one increases the other also increases and vice-versa, then such a relation is called a Positive Correlation. For example, Relationship between the price and supply, income and expenditure, height and weight, etc.
2. Negative Correlation:
When two variables move in opposite directions; i.e., when one increases the other decreases, and vice-versa, then such a relation is called a Negative Correlation. For example, the relationship between the price and demand, temperature and sale of woollen garments, etc.
Based on the ratio of variations between the variables, correlation can be classified as:
1. Linear Correlation:
When there is a constant change in the amount of one variable due to a change in another variable, it is known as Linear Correlation. This term is used when two variables change in the same ratio. If two variables that change in a fixed proportion are displayed on graph paper, a straight- line will be used to represent the relationship between them. As a result, it suggests a linear relationship.
In the above graph, for every change in the variable X by 5 units there is a change of 10 units in variable Y. The ratio of change of variables X and Y in the above schedule is 1:2 and it remains the same, thus there is a linear relationship between the variables.
2. Non-Linear (Curvilinear) Correlation:
When there is no constant change in the amount of one variable due to a change in another variable, it is known as a Non-Linear Correlation. This term is used when two variables do not change in the same ratio. This shows that it does not form a straight-line relationship. For example, the production of grains would not necessarily increase even if the use of fertilizers is doubled.
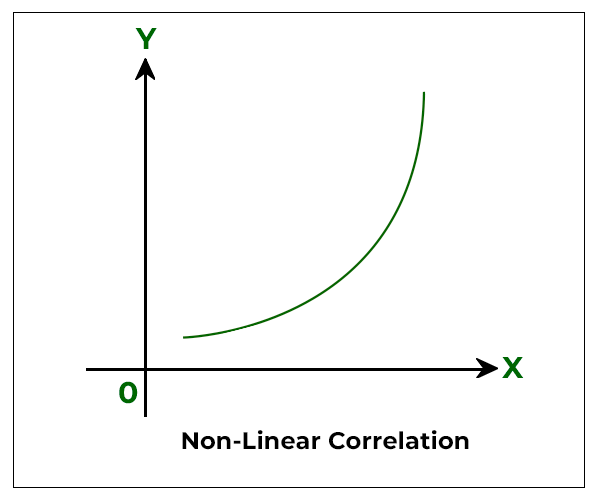
In the above schedule, there is no specific relationship between the variables. Even though both change in the same direction i.e. both are increasing, they change in different proportions. The ratio of change of variables X and Y in the above schedule is not the same, thus there is a non-linear relationship between the variables.
Based on the number of variables involved, correlation can be classified as:
1. Simple Correlation:
Simple correlation implies the study between the two variables only. For example, the relationship between price and demand, and the relationship between price and money supply.
2. Partial Correlation:
Partial correlation implies the study between the two variables keeping other variables constant. For example, the production of wheat depends upon various factors like rainfall, quality of manure, seeds, etc. But, if one studies the relationship between wheat and the quality of seeds, keeping rainfall and manure constant, then it is a partial correlation.
3. Multiple Correlation:
Multiple correlation implies the study between three or more three variables simultaneously. The entire set of independent and dependent variables is studied simultaneously. For example, the relationship between wheat output with the quality of seeds and rainfall.
Degree of Correlation
The degree of correlation is measured through the coefficient of correlation. The degree of correlation for the given variables can be expressed in the following ways:
1. Perfect Correlation:
If the relationship between the two variables is in such a way that it varies in equal proportion (increase or decrease) it is said to be perfectly correlated. This can be of two types:
- Positive Correlation: When the proportional change in two variables is in the same direction, it is said to be positively correlated. In this case, the Coefficient of Correlation is shown as +1.
- Negative Correlation: When the proportional change in two variables is in the opposite direction, it is said to be negatively correlated. In this case, the Coefficient of Correlation is shown as -1.
2. Zero Correlation:
If there is no relation between two series or variables, it is said to have zero or no correlation. It means that if one variable changes and it does not have any impact on the other variable, then there is a lack of correlation between them. In such cases, the Coefficient of Correlation will be 0.
3. Limited Degree of Correlation:
There is a situation with a limited degree of correlation between perfect and absence of correlation. In real life, it was found that there is a limited degree of correlation.
- The coefficient of correlation, in this case, lies between +1 and -1.
- Correlation is limited negative when there are unequal changes in the opposite direction.
- Correlation is limited and positive when there are unequal changes in the same direction.
- The degree of correlation can be low (when the coefficient of correlation lies between 0 and 0.25), moderate (when the coefficient of correlation lies between 0.25 and 0.75), or high (when the coefficient of correlation lies between 0.75 and 1).
Within these limits, the value of correlation can be interpreted as:

Share your thoughts in the comments
Please Login to comment...