Contingency Table in Python
Last Updated :
21 Mar, 2024
Estimations like mean, median, standard deviation, and variance are very much useful in case of the univariate data analysis. But in the case of bivariate analysis(comparing two variables) correlation comes into play.
Contingency Table is one of the techniques for exploring two or even more variables. It is basically a tally of counts between two or more categorical variables.
Loading Libraries
import numpy as np
import pandas as pd
import matplotlib as plt
|
Loading Data
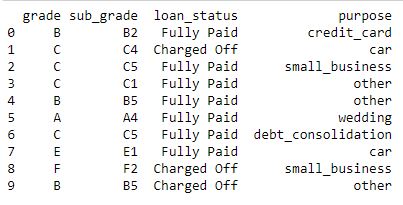
data = pd.read_csv("loan_status.csv")
print (data.head(10))
|
Output:
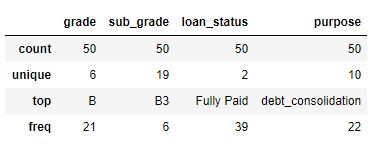
Describe Data
Output:
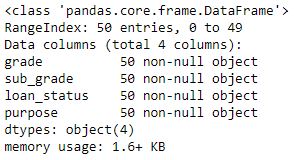
Data Info
Output:
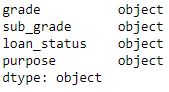
Data Types
Output:
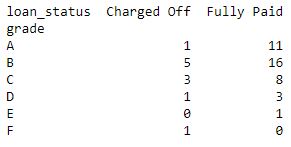
Code #1: Contingency Table showing correlation between Grades and loan status.
data_crosstab = pd.crosstab(data['grade'],
data['loan_status'],
margins = False)
print(data_crosstab)
|
Output:
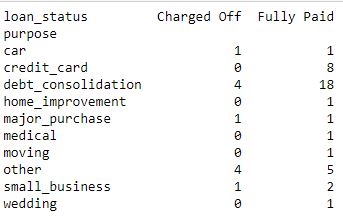
Code #2: Contingency Table showing correlation between Purpose and loan status.
data_crosstab = pd.crosstab(data['purpose'],
data['loan_status'],
margins = False)
print(data_crosstab)
|
Output:
Code #3: Contingency Table showing correlation between Grades+Purpose and loan status.
data_crosstab = pd.crosstab([data.grade, data.purpose],
data.loan_status, margins = False)
print(data_crosstab)
|
Output:
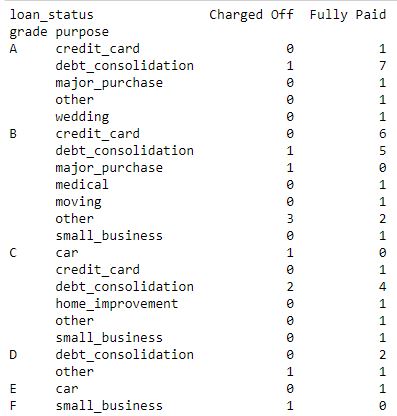
So as in the code, Contingency Tables are giving clear correlation values between two and more variables. Thus making it much more useful to understand the data for further information extraction.
.
Share your thoughts in the comments
Please Login to comment...