Compute the Value of Cumulative Weibull Density in R Programming – pweibull() Function
Last Updated :
25 Jun, 2020
pweibull() function in R Language is used to compute the value of Cumulative Distribution Function for Weibull Distribution. It also plots a density graph for Cumulative Weibull Function.
Syntax: pweibull(x, shape)
Parameters:
x: Numeric Vector
shape: Shape Parameter
Example 1:
x <- seq(-5, 15, by = 1)
y <- pweibull(x, shape = 0.2)
y
|
Output:
 [1] 0.0000000 0.0000000 0.0000000 0.0000000 0.0000000 0.0000000 0.6321206
 [8] 0.6829508 0.7122695 0.7327332 0.7483534 0.7609229 0.7713981 0.7803493
[15] 0.7881434 0.7950303 0.8011877 0.8067464 0.8118052 0.8164408 0.8207138
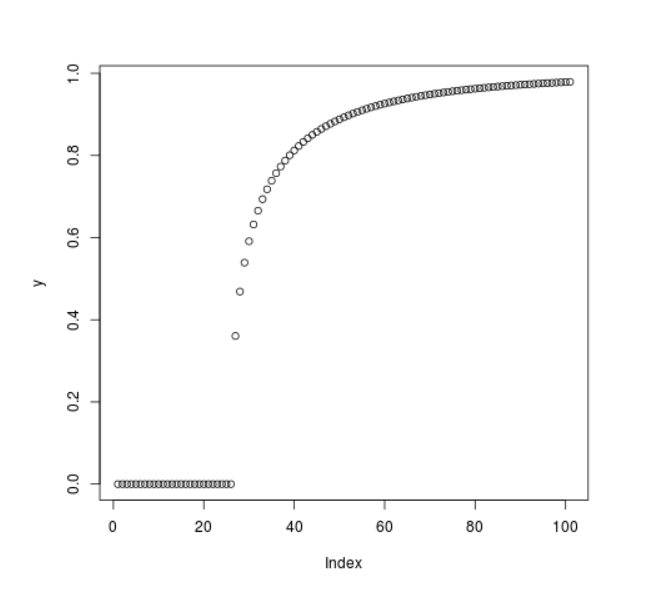
Example 2:
x <- seq(-5, 15, by = 0.2)
y <- pweibull(x, shape = 0.5)
plot(y)
|
Output:
Share your thoughts in the comments
Please Login to comment...