Gamma Distribution in R Programming – dgamma(), pgamma(), qgamma(), and rgamma() Functions
Last Updated :
11 Mar, 2024
The Gamma distribution in R Programming Language is defined as a two-parameter family of continuous probability distributions which is used in exponential distribution, Erlang distribution, and chi-squared distribution. This article is about the implementation of functions of the gamma distribution.
dgamma() Function
The dgamma() function is used to create a gamma density plot which is basically used due to exponential and normal distribution factors.
Syntax:
dgamma(x_dgamma, shape)
Parameters:
- x_dgamma: defines gamma function
- shape: gamma density of input values
- Returns: Plot dgamma values
Example :
R
x_dgamma <- seq(0, 2, by = 0.04)
y_dgamma <- dgamma(x_dgamma, shape = 6)
plot(y_dgamma)
|
Output :
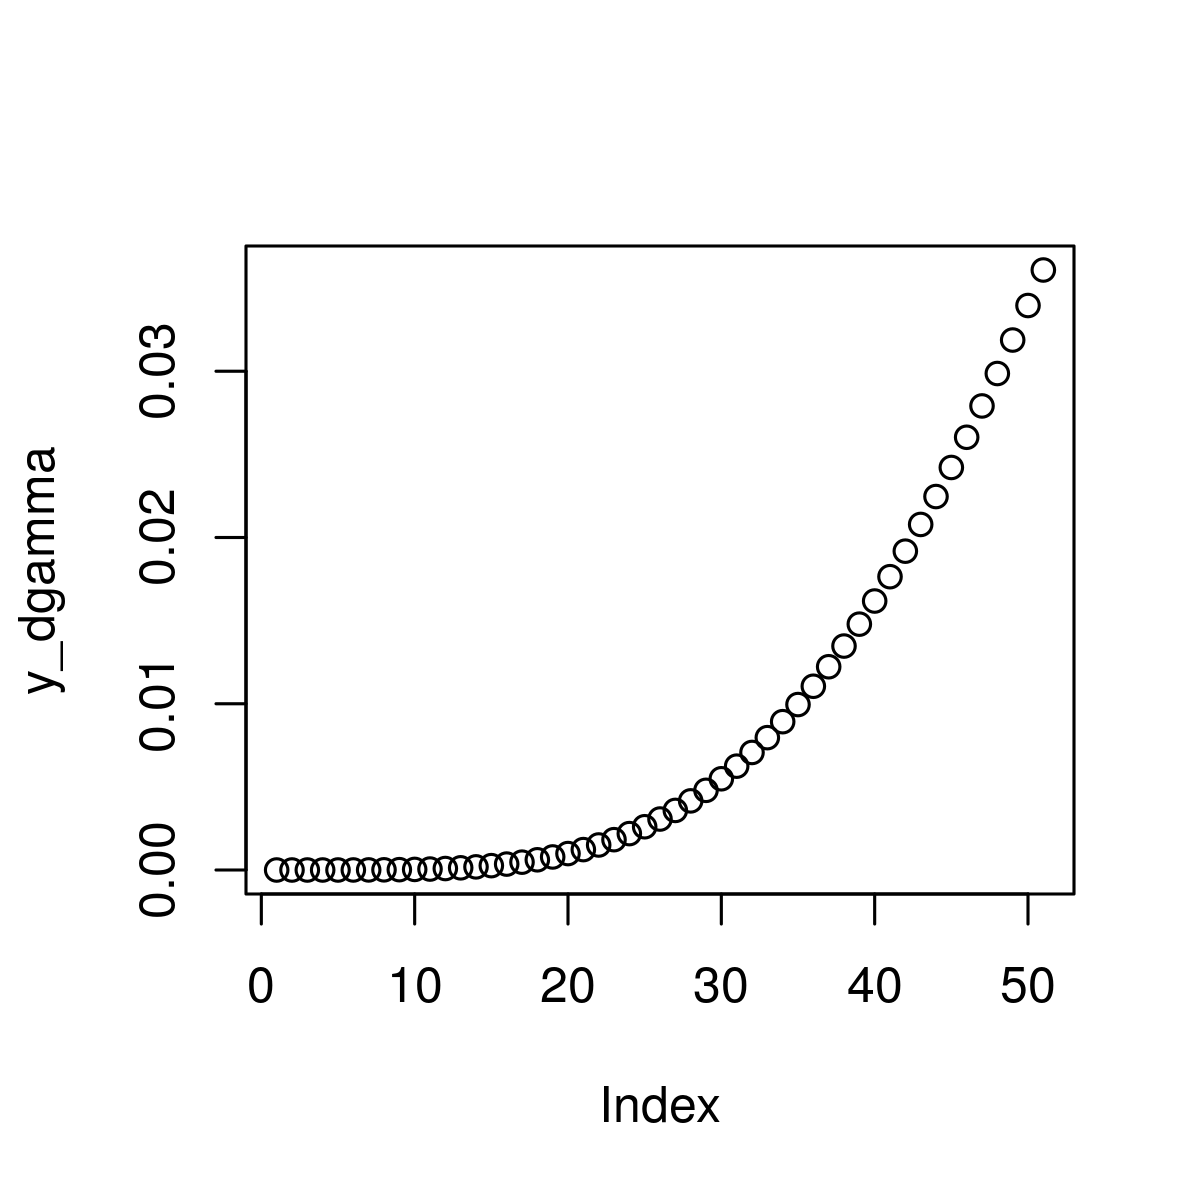
Gamma Distribution in R
pgamma() Function
The pgamma() function is used in the cumulative distribution function (CDF) of the gamma distribution.
Syntax: pgamma(x_pgamma, shape)
Parameters:
- x_pgamma: defines gamma function
- shape: gamma density of input values
- Returns: Plot pgamma values
R
x_pgamma <- seq(0, 2, by = 0.04)
y_pgamma <- pgamma(x_pgamma, shape = 6)
plot(y_pgamma)
|
Output:
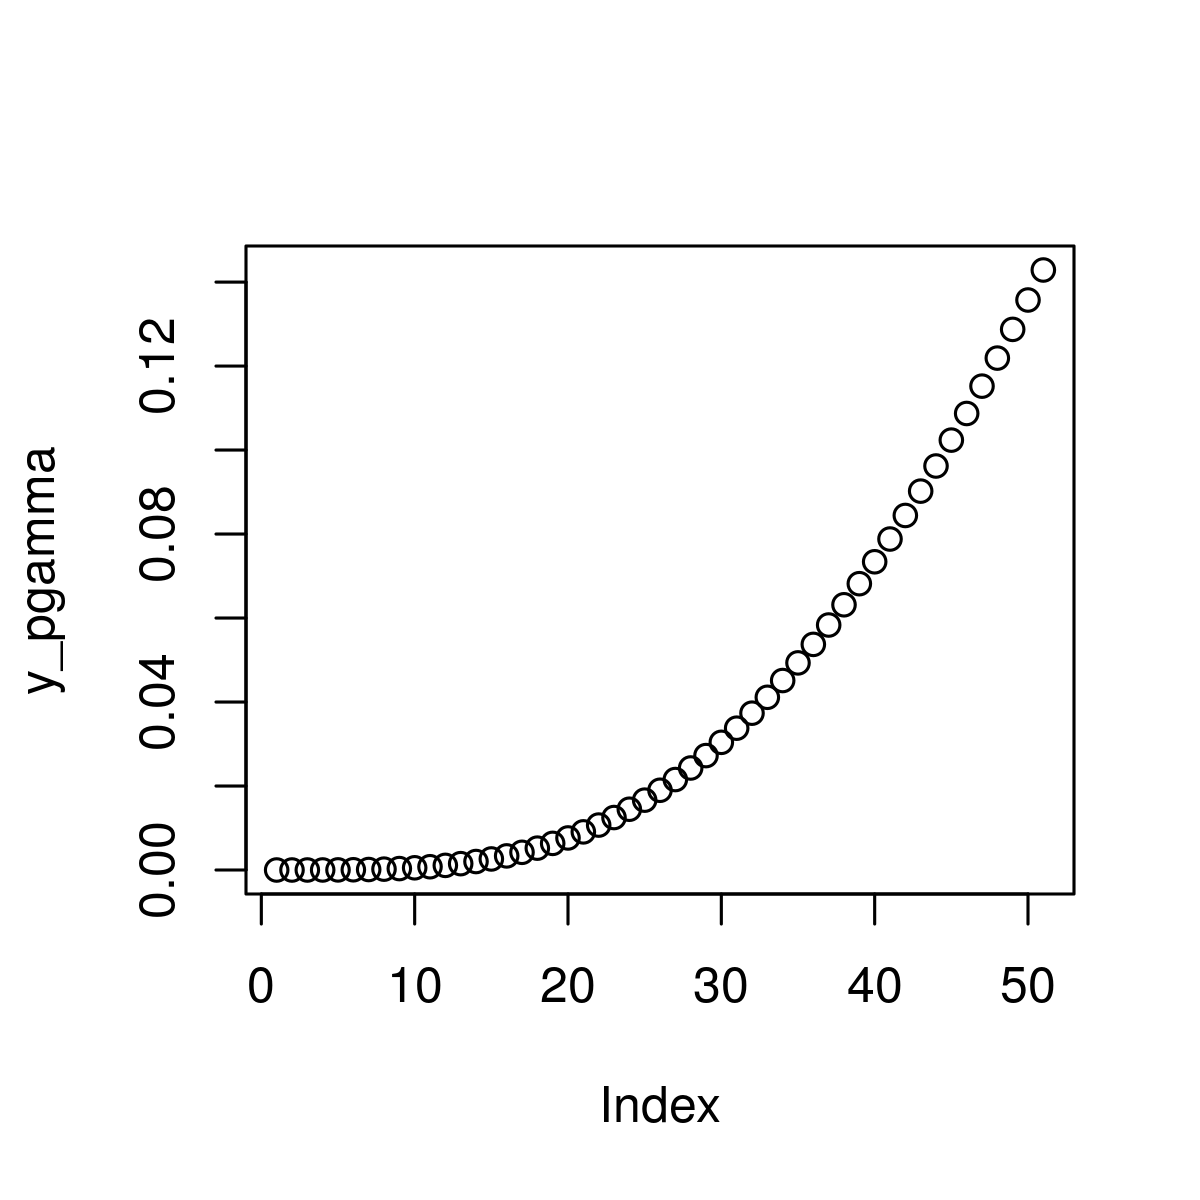
Cumulative Gamma Distribution Function
qgamma() Function
It is known as the gamma quantile function of the gamma distribution and is used to plot qgamma distribution.
Syntax: qgamma(x_qgamma, shape)
Parameters:
- x_qgamma: defines gamma function
- shape: gamma density of input values
- Returns: Plot qgamma values with gamma density
R
x_qgamma <- seq(0, 1, by = 0.03)
y_qgamma <- qgamma(x_qgamma, shape = 6)
plot(y_qgamma)
|
Output:
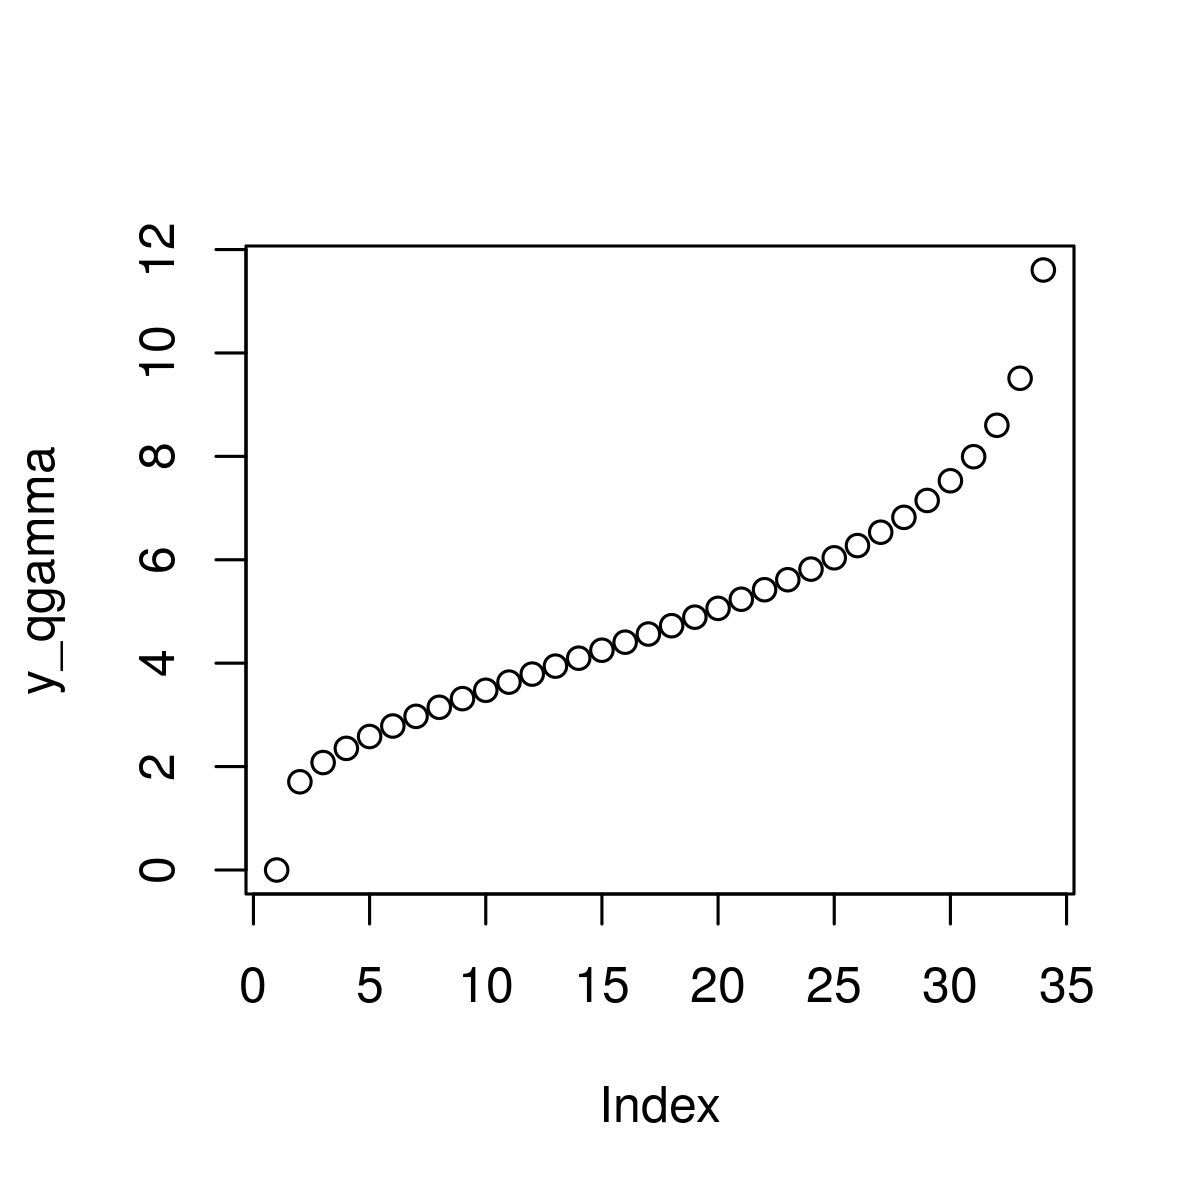
Quantile Function of Gamma Distribution
rgamma() Function
This function is basically used for generating random numbers in gamma distribution.
Syntax:
rgamma(N, shape)
Parameters:
- N: gamma distributed values
- shape: gamma density of input values
- Returns: Plot rgamma values with gamma density
R
set.seed(1200)
N <- 800
y_rgamma <- rgamma(N, shape = 5)
y_rgamma
hist(y_rgamma, breaks = 500,
main = "")
|
Output:
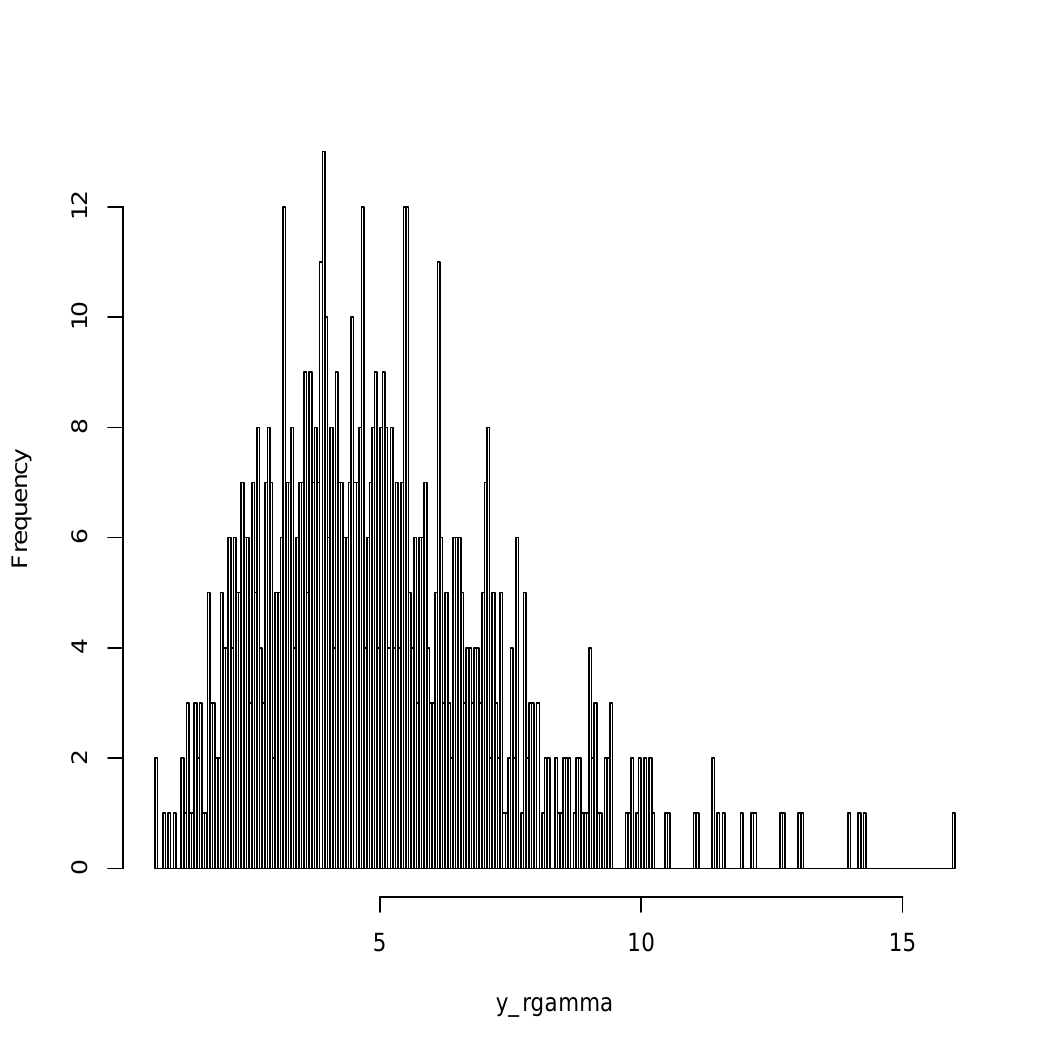
Histogram of 100 Gamma Distributed Numbers
Like Article
Suggest improvement
Share your thoughts in the comments
Please Login to comment...