Chart.js Title Configuration
Last Updated :
28 Oct, 2023
In this article, we will learn the concept of Chart.Js Title Configuration by using the Chart.js CDN library, along with understanding their basic implementation through the illustrations.
In Chart.js, Title Configuration is mainly the config option to customize and manage the title of the chart. There are different types of configurations that are embedded here. The options.plugins.title is the global option that defines the chat title in Chart.defaults.plugins.title.
Title Configuration Options
There are some of the options are mentioned below:
- align: This option allows you to align the text in “start”, “center” or “end”. It is of String type & the default value is center.
- color: This option is used to set the color of the text. It is of Color type & the default value is Chart.defaults.color.
- display: This is used to control the visibility of the title on screen. It is of Boolean type & default value is false.
- fullSize: It helps to define the full width/height of the canvas box. It is of Boolean type & default value is true.
- position: It helps to define the position for the title of the Chart. It is of String type & the default value is top.
- font: It is used to set the font for the Chart. It is of Font type & the default value is bold.
- padding: It is used to implement the padding around the title, where only the top & bottom can be implemented. It is of padding type & the default value is 10.
- text: This is the actual text which will be displayed as a title on the screen. It is of string|string[] type & the default value is ‘ ‘.
Approach
- In the HTML design, use the HTML <canvas> tag to mainly show the graph.
- In this script part of the code, firstly we need to initialize the object of the ChartJS by setting different properties like type, label, data, and other options.
- In the options property, we have aligned the configuration. So we need to define different properties for this title configuration like display, text, align, color, fullSize, position, etc.
CDN link
<script src=
"https://ajax.googleapis.com/ajax/libs/jquery/3.6.1/jquery.min.js">
</script>
<script src=
"https://cdnjs.cloudflare.com/ajax/libs/Chart.js/4.1.2/chart.umd.js">
</script>
Syntax
options: {
    plugins: {
        title: {
            display: true,
            text: 'Title Text',
            align: 'center',
            color: 'black',
            fullSize: true,
            position: 'top',
            font: {
                size: 16,
                weight: 'normal',
                family: 'Arial',
                style: 'normal'
            },
            padding: {
                top: 10,
                bottom: 10,
                left: 10,
                right: 10
            }
        }
    }
}
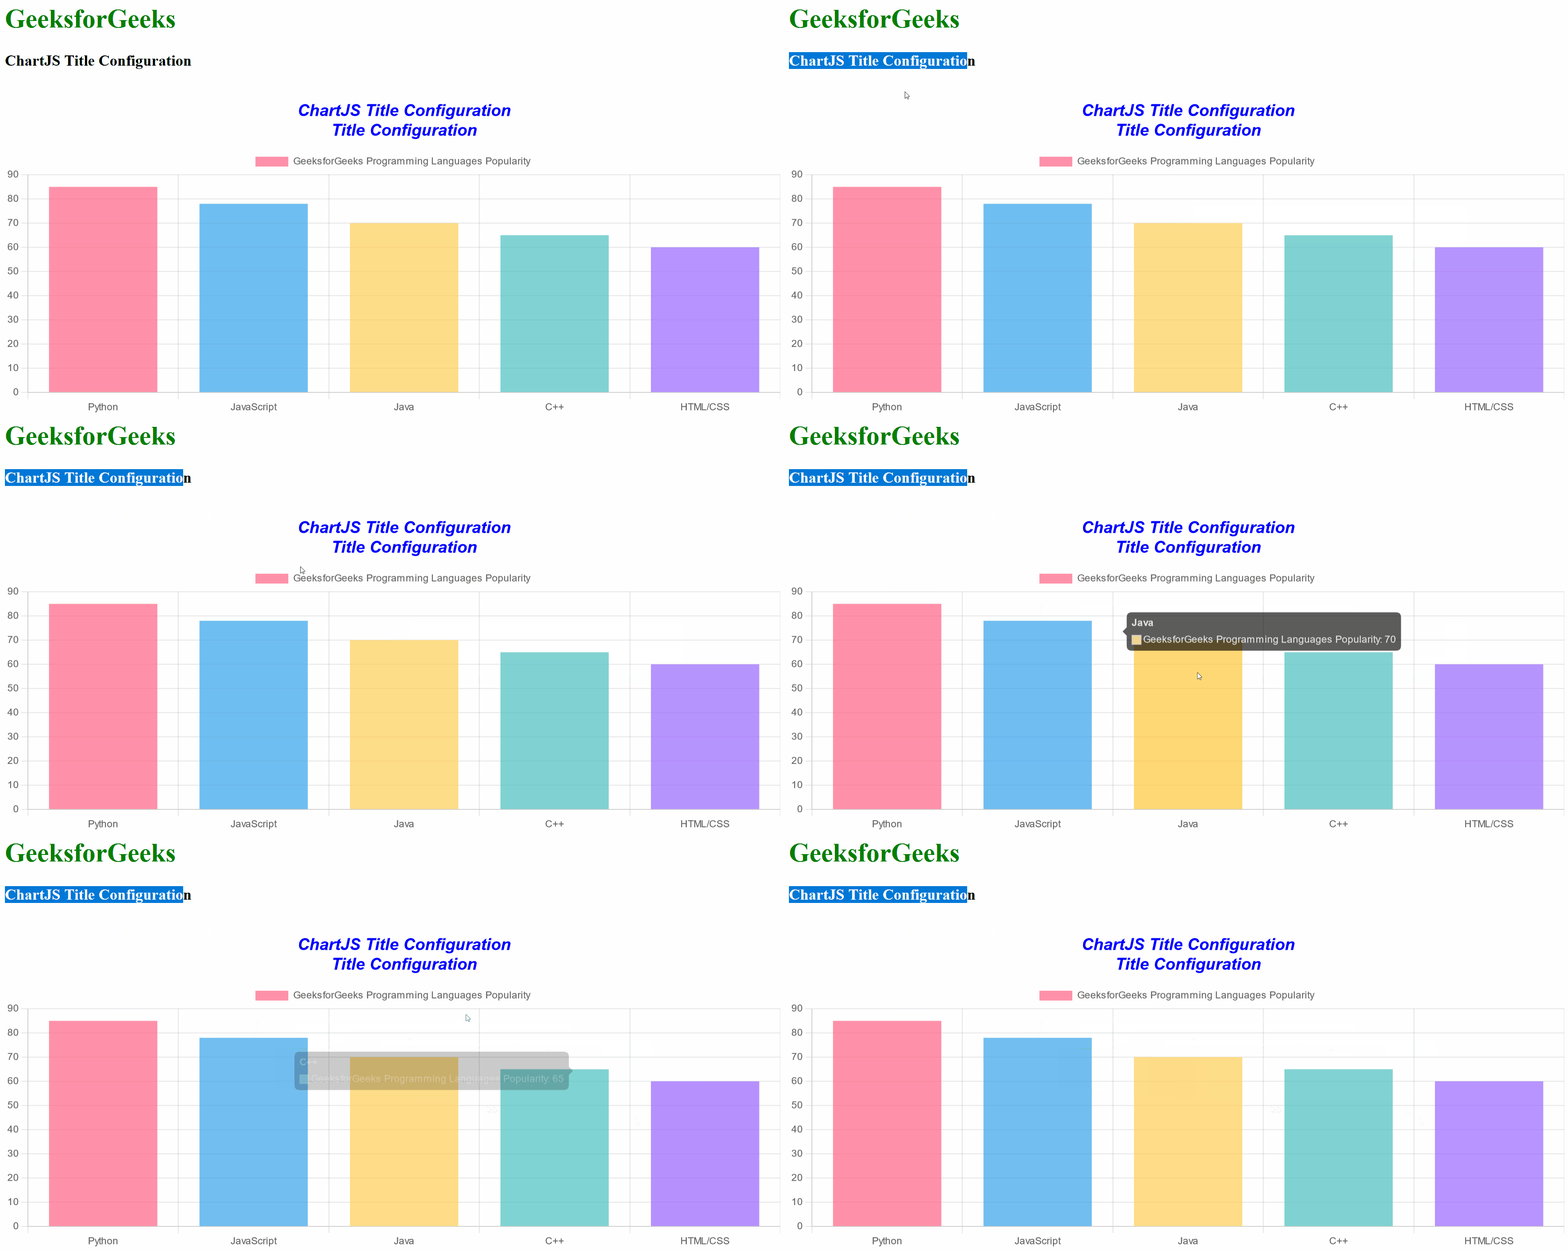
Example 1: In this example, we are representing the Popularity of Programming Languages in the bar chart representation. Here, we have defined the data and represented the chart. Here, there is a title configuration, which consists of different sub-options like display, font, padding, position, align, etc. We have given different colors, font-size, weight of the text, family, etc. We can make the title more attractive and customizable by changing these values.
HTML
<!DOCTYPE html>
<html>
<head>
<title>
ChartJS Title Configuration
</title>
<script src=
</script>
<script src=
</script>
</head>
<body>
<h1 style="color:green;">
GeeksforGeeks
</h1>
<h3 style="color:black;">
ChartJS Title Configuration
</h3>
<canvas id="myChart"
width="700"
height="300">
</canvas>
<script>
var ctx =
document.getElementById('myChart').getContext('2d');
var myChart = new Chart(ctx, {
type: 'bar',
data: {
labels: ['Python',
'JavaScript',
'Java',
'C++',
'HTML/CSS'],
datasets: [{
label:
'GeeksforGeeks Programming Languages Popularity',
data: [85, 78, 70, 65, 60],
backgroundColor: [
'rgba(255, 99, 132, 0.7)',
'rgba(54, 162, 235, 0.7)',
'rgba(255, 206, 86, 0.7)',
'rgba(75, 192, 192, 0.7)',
'rgba(153, 102, 255, 0.7)'
]
}]
},
options: {
plugins: {
title: {
display: true,
text: ['ChartJS Title Configuration',
'Title Configuration'],
align: 'center',
color: 'blue',
fullSize: false,
position: 'top',
font: {
size: 20,
weight: 'bold',
family: 'Arial',
style: 'italic'
},
padding: {
top: 20,
bottom: 10
}
}
}
}
});
</script>
</body>
</html>
|
Output

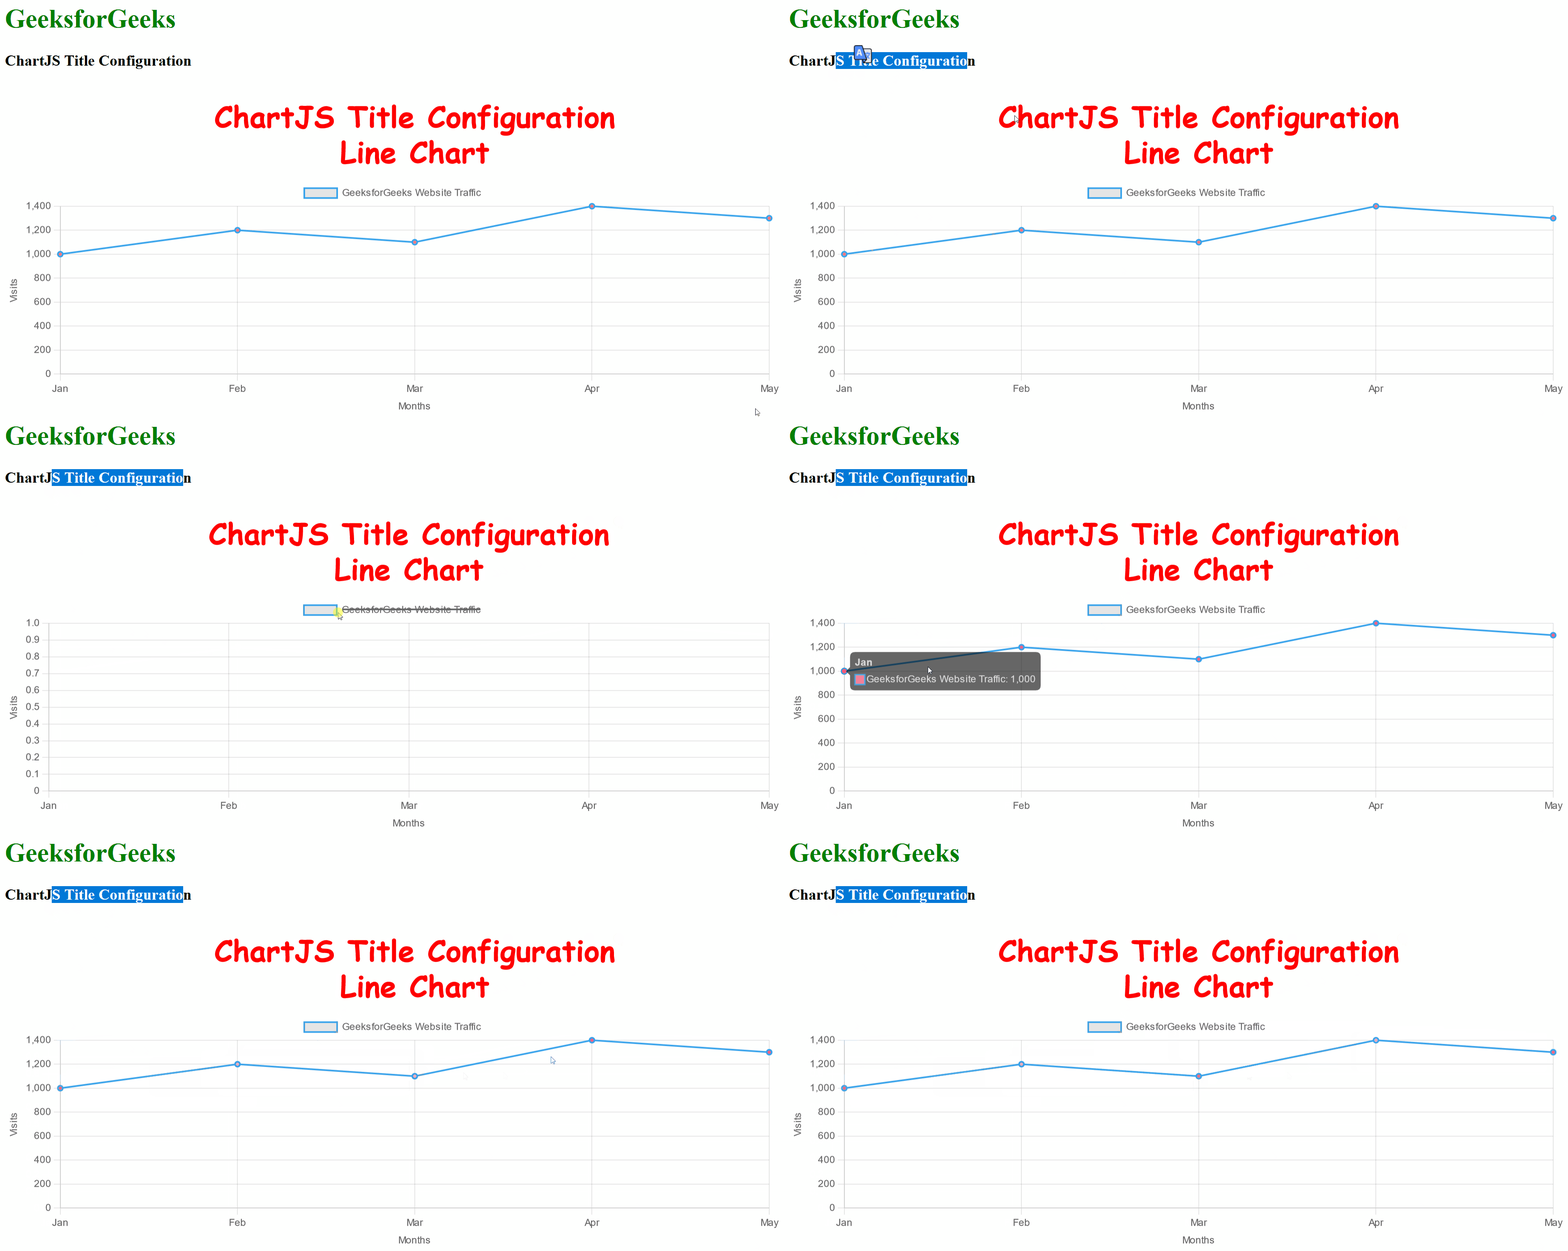
Example 2: In this example, we are representing the “GeeksforGeeks” website visitor’s sample data in terms of Line Chart representation. Here we have defined the dataset and also we have used the Title Configuration. In the Title Configuration, we have given the name to our chart. Also, we have specified almost all the options like display, align, color, font, padding, etc. Using these options we can make the Chart appearance more attractive.
HTML
<!DOCTYPE html>
<html>
<head>
<title>
ChartJS Title Configuration
</title>
<script src=
</script>
<script src=
</script>
</head>
<body>
<h1 style="color:green;">
GeeksforGeeks
</h1>
<h3 style="color:black;">
ChartJS Title Configuration
</h3>
<canvas id="myChart"
width="700"
height="300">
</canvas>
<script>
var ctx =
document.getElementById('myChart').getContext('2d');
var myChart = new Chart(ctx, {
type: 'line',
data: {
labels: ['Jan', 'Feb', 'Mar',
'Apr', 'May'],
datasets: [{
label:
'GeeksforGeeks Website Traffic',
data: [1000, 1200, 1100, 1400, 1300],
borderColor: 'rgba(54, 162, 235, 1)',
borderWidth: 2,
pointBackgroundColor:
'rgba(255, 99, 132, 1)'
}]
},
options: {
plugins: {
title: {
display: true,
text:
['ChartJS Title Configuration',
'Line Chart'],
align: 'center',
color: 'red',
fullSize: false,
position: 'top',
font: {
size: 36,
weight: 'bold',
family: 'Indie Flower, cursive',
style: 'normal'
},
padding: {
top: 20,
bottom: 10
}
}
},
scales: {
y: {
beginAtZero: true,
title: {
display: true,
text: 'Visits'
}
},
x: {
title: {
display: true,
text: 'Months'
}
}
}
}
});
</script>
</body>
</html>
|
Output

Reference: https://www.chartjs.org/docs/latest/configuration/title.html#title-configuration
Share your thoughts in the comments
Please Login to comment...