Chart.js General Performance
Last Updated :
14 Dec, 2023
Chart.js charts are speedily rendered thanks to their utilization of canvas elements. This choice of rendering contributes to swift performance, allowing for the creation of dynamic and visually appealing charts.
Data Structure and Format
- parsing: Converting raw data into a format understandable by Chart.js for efficient processing and rendering.
- normalization of data: Standardizing data to a common scale or format, ensuring consistency and accuracy in chart representation.
- Decimation: Reducing the number of data points displayed in a chart for improved performance without sacrificing essential information.
Specify min and max for scale
Setting the minimum and maximum values for the scale to define the range of data displayed in the chart.
Syntax
const chartOptions = {
  type: 'line',
  data: data,
  options: {
    scales: {
      x: [{
        type: 'time',
        time: {
          min: min_value,
          max: max_value
        }
      }],
      y: [{
        type: 'linear',
        min: 0,
        max: 100
      }]
    }
  }
};
Disable animation
The sensitive data or large size data takes time to display chart. The animation takes time to display chart for the large size data and it is affecting on the performance of the Chart.js.
Syntax
The syntax shows the animation disability of the Chart.js
new Chart($("#Canvas_ID"), {
    type: 'line',
    data: { ... },
    options: {
    animation: false
    }
});
Example 1: In this example, a Chart.js bar chart is created to visualize a dataset with days of the week on the x-axis and corresponding values on the y-axis. The chart is configured with custom styling and features, including specified background colors and point radii. Additionally, the “parsing” option is explicitly set to false in the chart options.
HTML
<!DOCTYPE html>
<html lang="en">
<head>
<meta charset="UTF-8">
<meta name="viewport"
content="width=device-width,
initial-scale=1.0">
<title>Document</title>
</head>
<body>
<h1> Geeks For Geeks </h1>
<h3> Chart.js General Performance </h3>
<canvas id="chartId"
aria-label="chart"
heigth="500"
width="500">
</canvas>
<script src=
</script>
<script src=
</script>
<script>
var chartId = new Chart($("#chartId"), {
type: 'bar',
data: {
labels: ["Monday",
"Tuesday",
"Wednesday",
"Thursday",
"Friday",
"Saturday"],
datasets: [{
label: "DataSet",
data: [20, 40, 30, 45, 35, 25],
backgroundColor: ['orange',
'aqua',
'pink',
'lightgreen',
'lightblue',
'yellow'],
borderWidth: 3,
pointRadius: 5,
}],
},
options: {
parsing: false,
},
});
</script>
</body>
</html>
|
Output:

Basic Chart.js General Performance
Example 2: In this example, a Chart.js line chart is implemented to represent a dataset featuring days of the week on the x-axis and corresponding values on the y-axis. The chart is styled with custom features, such as specified background colors, border width, and point radii. Also the “normalized” option is explicitly set to true in the chart options.
HTML
<!DOCTYPE html>
<html lang="en">
<head>
<meta charset="UTF-8">
<meta name="viewport"
content="width=device-width,
initial-scale=1.0">
<title>Document</title>
</head>
<body>
<h1> Geeks For Geeks </h1>
<h3> Chart.js General Performance </h3>
<canvas id="chartId"
aria-label="chart"
heigth="500"
width="500">
</canvas>
<script src=
</script>
<script src=
</script>
<script>
var chartId = new Chart($("#chartId"), {
type: 'line',
data: {
labels: ["Monday",
"Tuesday",
"Wednesday",
"Thursday",
"Friday",
"Saturday"],
datasets: [{
label: "DataSet",
data: [10, 40, 30, 45, 35, 25],
backgroundColor: ['orange',
'aqua',
'pink',
'lightgreen',
'lightblue',
'yellow'],
borderWidth: 3,
pointRadius: 5,
}],
},
options: {
normalized: true,
},
});
</script>
</body>
</html>
|
Output:
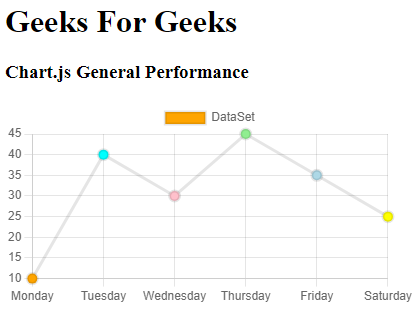
Chart.js normalized General Performace
Share your thoughts in the comments
Please Login to comment...