Chart.js Data Decimation Configuration
Last Updated :
11 Dec, 2023
Chart.js Data Decimation is the feature developed for line charts, allowing us to reduce the data points automatically. By this, the chart’s performance and visuals are optimized in proper clear form.
Syntax:
options: {
  plugins: {
    decimation: {
      algorithm: 'lttb', or  'min-max'
      // Other configuration options
    }
  }
}
Data Decimation Configuration Options
- enables: This option is used to control the data decimation, which enhances the chart performance by reducing the data points automatically.
- algorithm: This option is used to specify the decimation algorithm like (LTTB or min-max) to perform the chart representation either for minimal data points or peak preservation.
- samples: This option is used when the LTTB algorithm is used, this determines the number of samples in the output dataset by controlling the level of data granularity.
- threshold: This option is used to set the trigger point for decimation.
Data Decimation Configuration Algorithms
- Largest Triangle Three Bucket (LTTB) Decimation: This algorithm is developed to reduce the number of data points by revealing the trends in the data using a sparse dataset. The most efficient use of the algorithm is in the scenarios where the simplified view of the data is intended to be displayed.
- Min/Max Decimation: This algorithm preserves the peak in the data while potentially requiring more points for each pixel. This algorithm is helpful when charts with noisy signals emphasize retaining the crucial data peaks for analysis.
CDN link
<script src="https://ajax.googleapis.com/ajax/libs/jquery/3.6.1/jquery.min.js"></script>
<script src="https://cdnjs.cloudflare.com/ajax/libs/Chart.js/4.1.2/chart.umd.js"></script>
Example 1: In the below example, we are representing the Monthly Visitor’s data on GeeksforGeeks in Line Chart form. For the data reduction, we have set the plugins.decimation.algorithm option set to ‘lttb‘. This option reduces the data points by selecting the key triangles in the data.
HTML
<!DOCTYPE html>
<html lang="en">
<head>
<meta charset="UTF-8">
<meta name="viewport"
content="width=device-width,
initial-scale=1.0">
<title>LTTB Decimation Example</title>
<script src=
</script>
<script src=
</script>
</head>
<body>
<div>
<h1 style="color:green;">GeeksforGeeks</h1>
<h3>Data Decimation Configuration - LTTB </h3>
<div style="width:80%;">
<canvas id="lttbChart"></canvas>
</div>
</div>
<script>
const geeksData = {
labels: ['Jan', 'Feb', 'Mar',
'Apr', 'May', 'Jun',
'Jul', 'Aug', 'Sep',
'Oct', 'Nov', 'Dec'],
datasets: [{
label: 'Monthly Visitors',
data: [120, 150, 80, 200, 130,
180, 110, 160, 90, 220,
170, 200],
fill: false,
borderColor: 'blue',
tension: 0.4,
}]
};
const ctx = document.getElementById('lttbChart').getContext('2d');
const lttbChart = new Chart(ctx, {
type: 'line',
data: geeksData,
options: {
plugins: {
decimation: {
enabled: true,
algorithm: 'lttb',
}
}
}
});
</script>
</body>
</html>
|
Output:

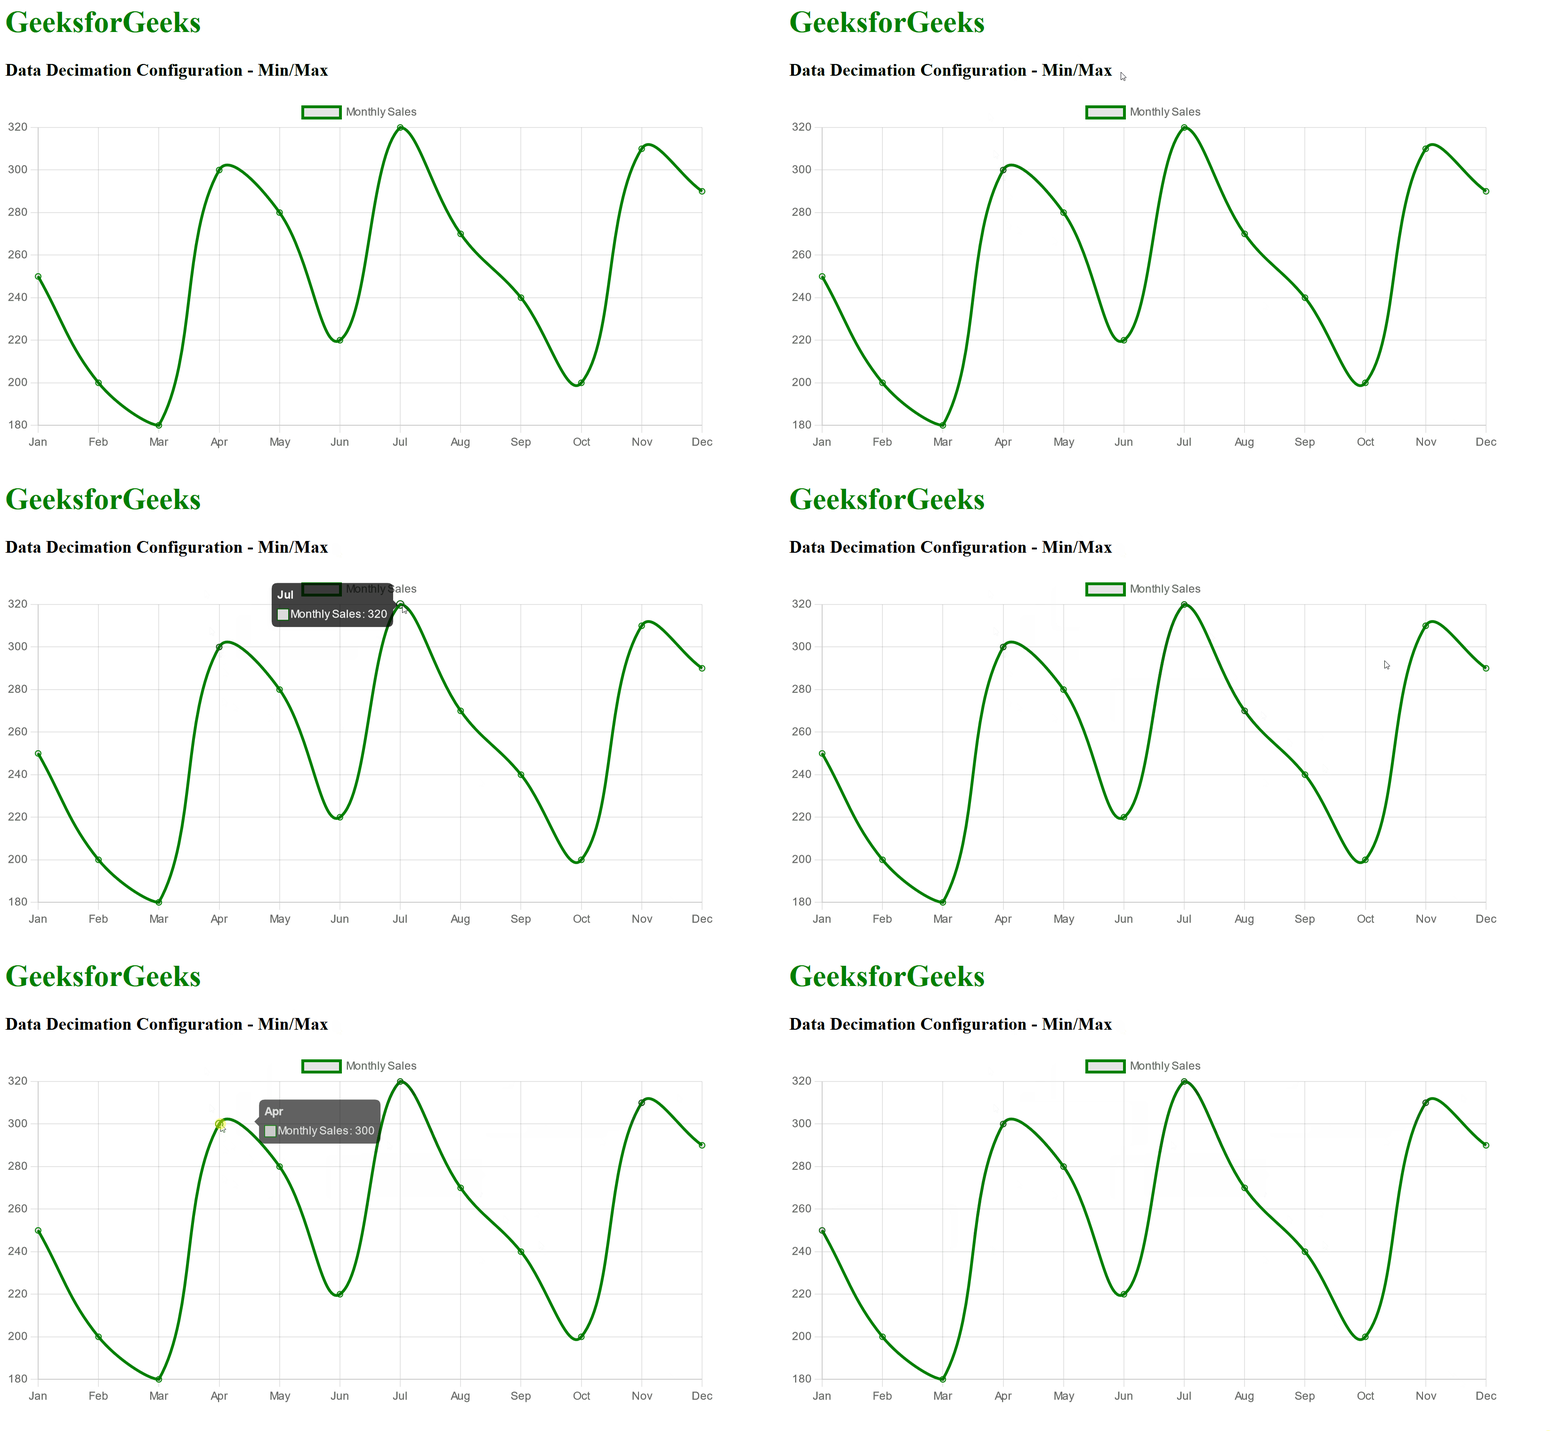
Example 2: In the below example, we have used the plugins.decimation.algorithm to ‘min-max‘ which preserves the peaks in the data by making it suitable for charts with noisy signals. This is used for critical data peaks and analysis.
HTML
<!DOCTYPE html>
<html lang="en">
<head>
<meta charset="UTF-8">
<meta name="viewport"
content="width=device-width,
initial-scale=1.0">
<title>Min/Max Decimation Example</title>
<script src=
</script>
<script src=
</script>
</head>
<body>
<div>
<h1 style="color:green;">GeeksforGeeks</h1>
<h3>Data Decimation Configuration - Min/Max </h3>
<div style="width:80%;">
<canvas id="minMaxChart"></canvas>
</div>
</div>
<script>
const sampleData = {
labels: ['Jan', 'Feb', 'Mar', 'Apr',
'May', 'Jun', 'Jul', 'Aug',
'Sep', 'Oct', 'Nov', 'Dec'],
datasets: [{
label: 'Monthly Sales',
data: [250, 200, 180, 300, 280,
220, 320, 270, 240, 200,
310, 290],
fill: false,
borderColor: 'green',
tension: 0.4,
}]
};
const ctx = document.getElementById('minMaxChart')
.getContext('2d');
const minMaxChart = new Chart(ctx, {
type: 'line',
data: sampleData,
options: {
plugins: {
decimation: {
enabled: true,
algorithm: 'min-max',
}
}
}
});
</script>
</body>
</html>
|
Output:

Share your thoughts in the comments
Please Login to comment...