Chart.js Device Pixel Ratio Configuration
Last Updated :
08 Dec, 2023
Chart.js Device Pixel Ratio Configuration option allows the users to override the default pixel ratio of the window, which provides control over the rendering resolution of the chart canvas.
Syntax:
const config = {
  options: {
    devicePixelRatio: 2 // Set your ratio value
  },
  // Other chart configurations
};
Device Pixel Ratio Configuration Options
Below is the configuration option for Device Pixel Ratio Configuration:
- devicePixelRatio: This option in Chart.js allows control over the rendering resolution of the chart canvas. This is the numerical value that overrides the window’s default ratio.
CDN link
<script src="https://ajax.googleapis.com/ajax/libs/jquery/3.6.1/jquery.min.js"></script>
<script src="https://cdnjs.cloudflare.com/ajax/libs/Chart.js/4.1.2/chart.umd.js"></script>
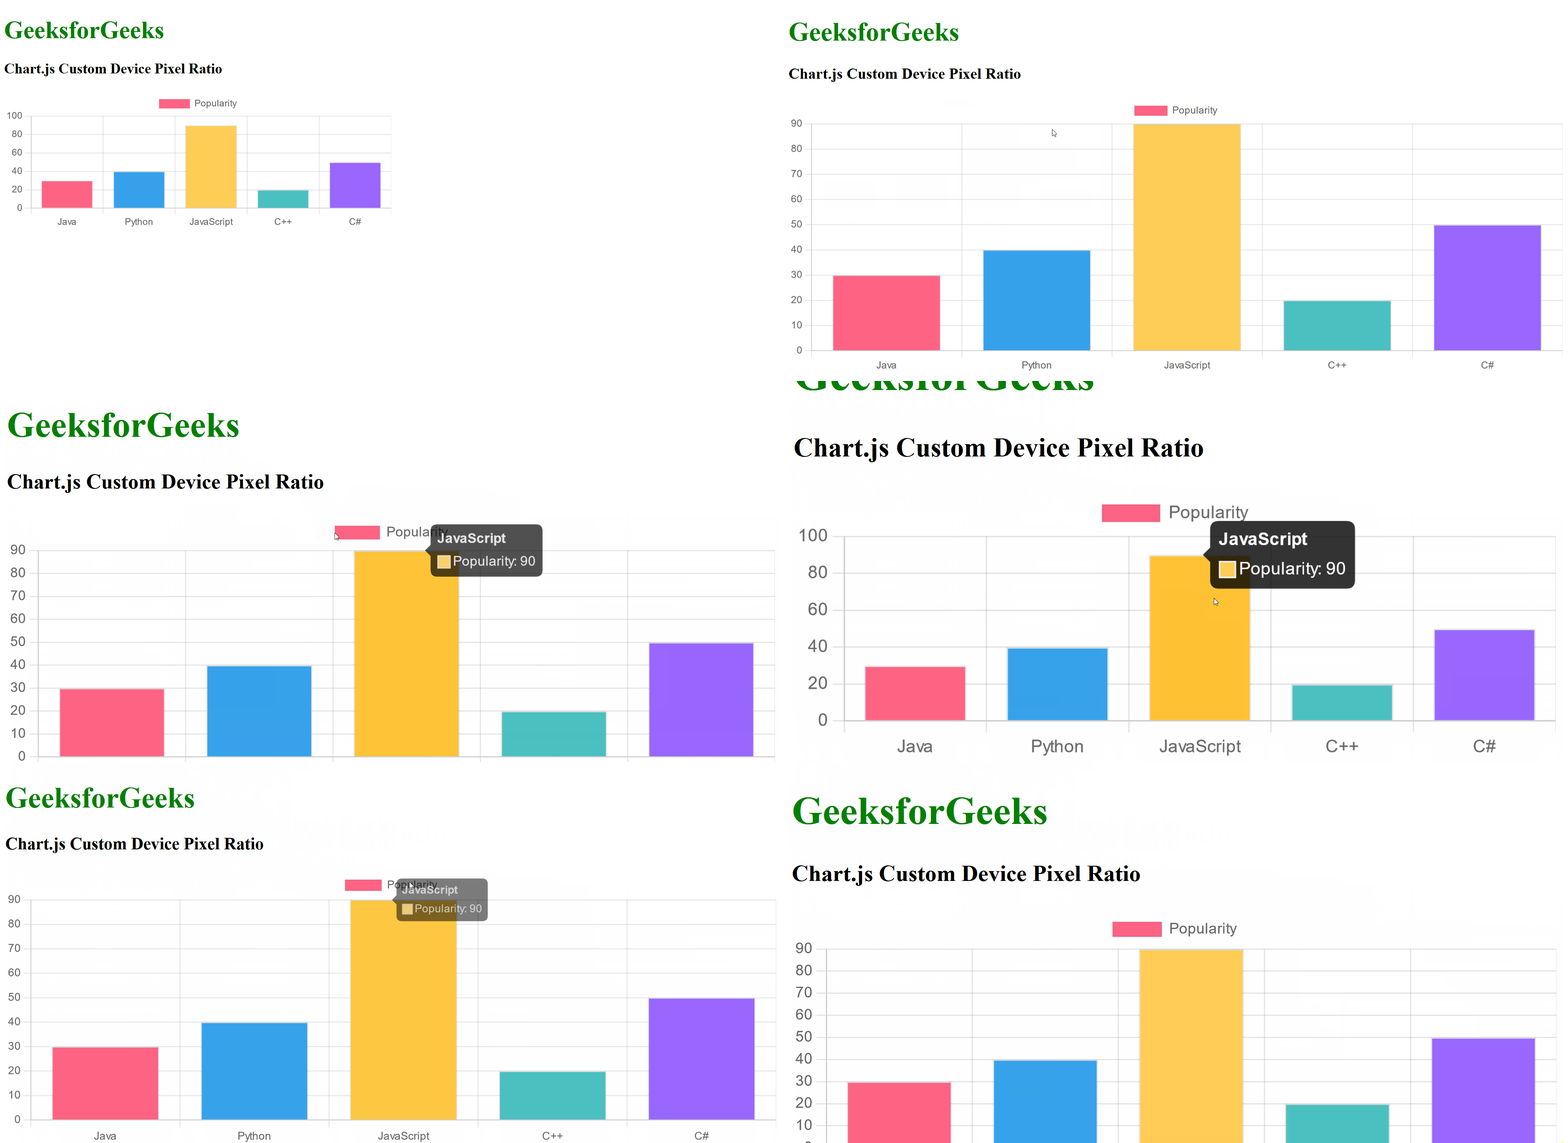
Example 1: In the below example, we have used the Bar chart to represent the information related to GeeksforGeeks programming languages. We have set the devicePixelRatio: 3, which allows us to properly view the chart canvas when it is zoomed, without losing any resolution of the canvas.
HTML
<!DOCTYPE html>
<html lang="en">
<head>
<meta charset="UTF-8">
<meta name="viewport"
content="width=device-width,
initial-scale=1.0">
<title>Bar Chart with Custom Device Pixel Ratio</title>
<script src=
</script>
<script src=
</script>
</head>
<body>
<div>
<h1 style="color:green;">GeeksforGeeks</h1>
<h3>Chart.js Custom Device Pixel Ratio</h3>
<div><canvas id="barChart"
width="700"
height="250">
</canvas></div>
</div>
<script>
const data = {
labels: ['Java', 'Python', 'JavaScript',
'C++', 'C#'],
datasets: [{
label: 'Popularity',
data: [30, 40, 90, 20, 50],
backgroundColor:
['rgb(255, 99, 132)',
'rgb(54, 162, 235)',
'rgb(255, 205, 86)',
'rgb(75, 192, 192)',
'rgb(153, 102, 255)'],
borderWidth: 1
}]
};
const configBar = {
type: 'bar',
data: data,
options: {
devicePixelRatio: 3
}
};
const ctxBar =
document.getElementById('barChart').getContext('2d');
const myBarChart = new Chart(ctxBar, configBar);
</script>
</body>
</html>
|
Output:

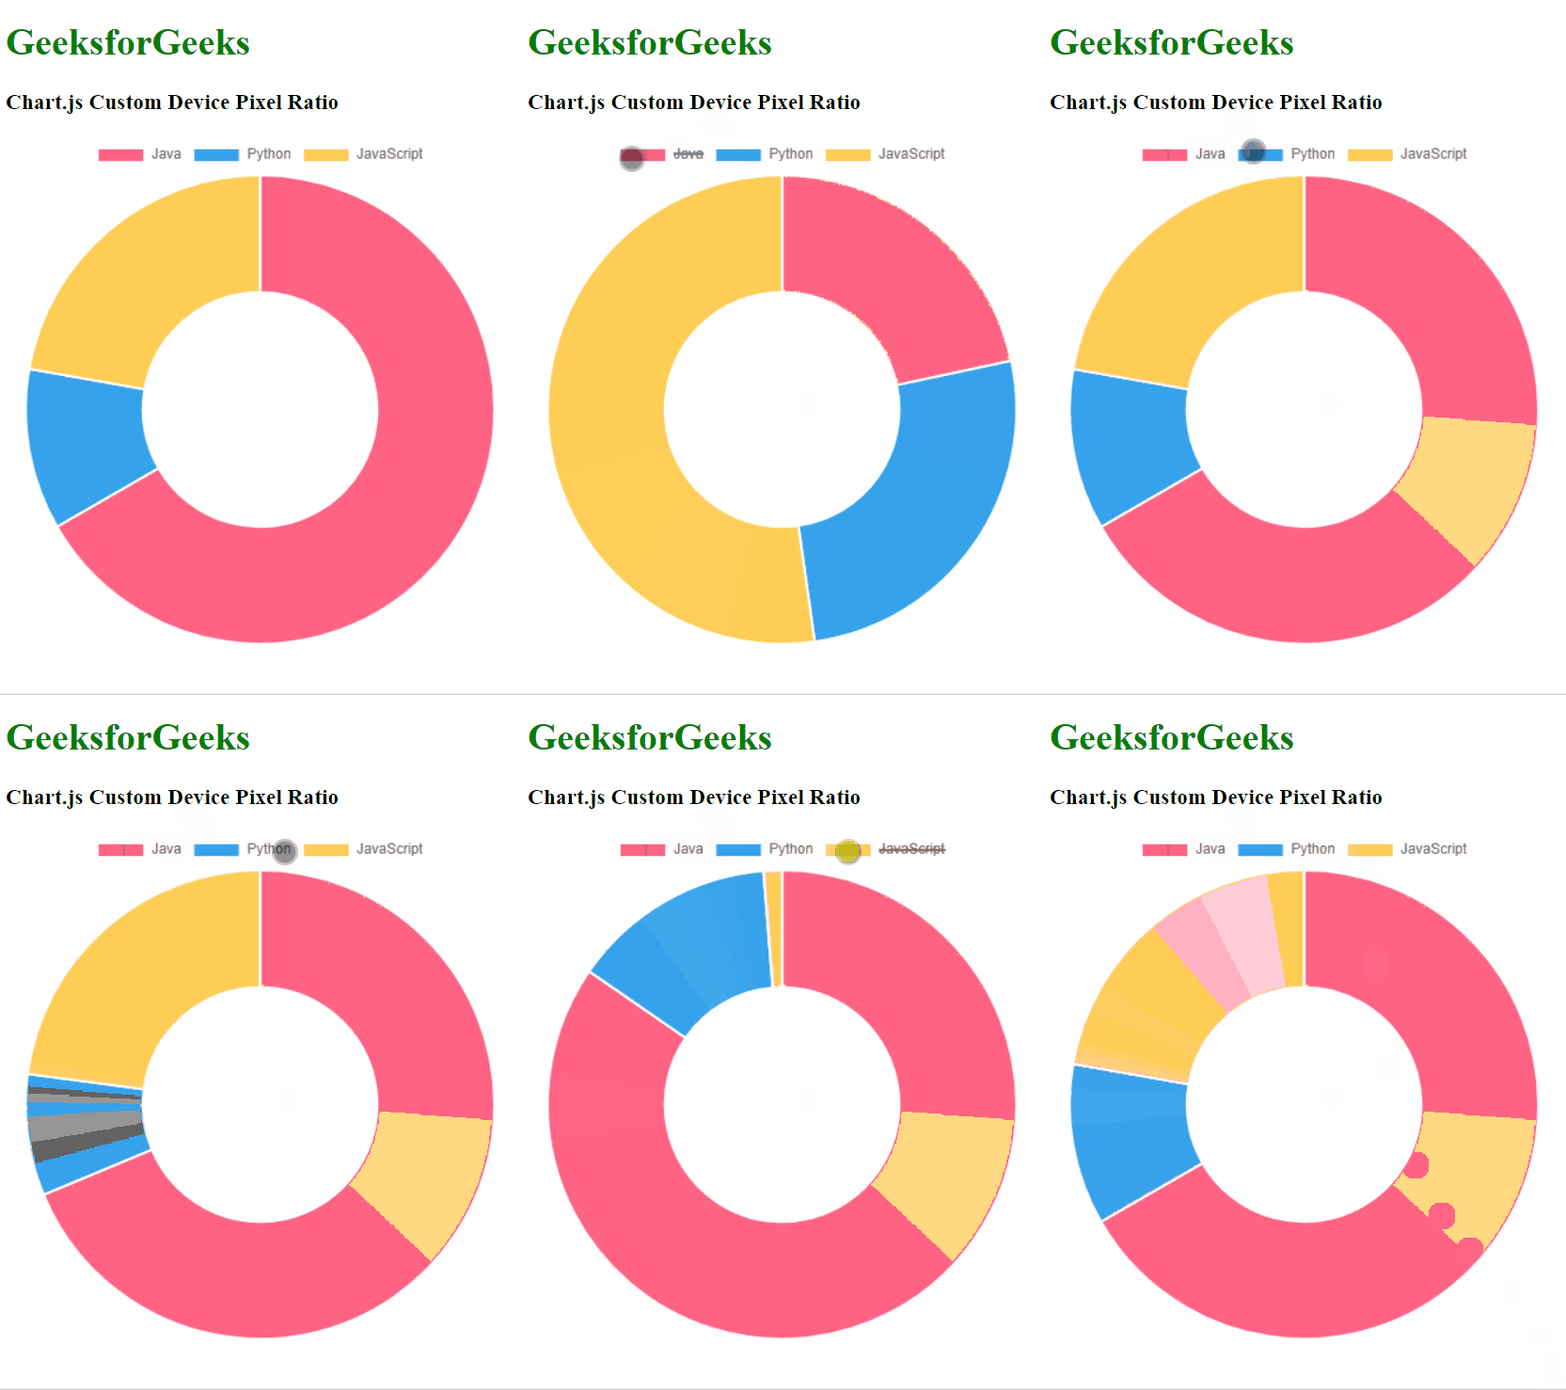
Example 2: In the below example, we have used the doughnut chart to represent the data in visual form. We have ket the devicePixelRatio: 1, which indicated the default value. As compared to Example 1, if we zoom in here, the Pixels of Doughnut chart is been loosed and the Chart is seen as blurred.
HTML
<!DOCTYPE html>
<html lang="en">
<head>
<meta charset="UTF-8">
<meta name="viewport"
content="width=device-width,
initial-scale=1.0">
<title>Chart.js Example - Custom Device Pixel Ratio</title>
<script src=
</script>
<script src=
</script>
</head>
<body>
<div>
<h1 style="color:green;">GeeksforGeeks</h1>
<h3>Chart.js Custom Device Pixel Ratio</h3>
<div><canvas id="chartCustom"
width="700"
height="250">
</canvas></div>
</div>
<script>
const data = {
labels: ['Java', 'Python', 'JavaScript'],
datasets: [{
label: 'Programming Languages',
data: [300, 50, 100],
backgroundColor: ['rgb(255, 99, 132)',
'rgb(54, 162, 235)',
'rgb(255, 205, 86)'],
hoverOffset: 4
}]
};
const configCustom = {
type: 'doughnut',
data: data,
options: {
devicePixelRatio: 1
}
};
const ctxCustom =
document.getElementById('chartCustom')
.getContext('2d');
const myChartCustom = new Chart(ctxCustom, configCustom);
</script>
</body>
</html>
|
Output:

Share your thoughts in the comments
Please Login to comment...