Chart.js Subtitle Configuration
Last Updated :
28 Oct, 2023
In this article, we will learn the concept of Chart.Js Subtitle Configuration by using the Chart.js CDN library, along with understanding their basic implementation through the illustrations.
In Chart.js, Subtitle Configuration is mainly the second title which is placed, by default, under the main title. The configuration options for subtitles are the same as the title configuration. The Chart.defaults.plugins.subtitle facilitates configuring the global defaults for Subtitles. Except for the namespaces, the rest of the configuration options will remain the same for the subtitle, as available for the Title.
Approach
- In the HTML design, use the HTML <canvas> tag to mainly display the graph.
- In this script part of the code, firstly we need to initialize the object of the ChartJS by setting different properties like type, label, data, and other options.
- In the options property, we have a subtitle configuration. Using this configuration, we can display the subtitle of the Chart. So we need to define different properties for this title configuration like display, text, align, color, fullSize, position, etc.
CDN link
<script src=
"https://ajax.googleapis.com/ajax/libs/jquery/3.6.1/jquery.min.js”>
</script>
<script src=
"https://cdnjs.cloudflare.com/ajax/libs/Chart.js/4.1.2/chart.umd.js”>
</script>
Syntax
options: {
    plugins: {
        subtitle: {
            display: true,
            text: 'Title Text',
            align: 'center',
            color: 'black',
            fullSize: true,
            position: 'top',
            font: {
                size: 16,
                    weight: 'normal',
                    family: 'Arial',
                    style: 'normal'
            },
            padding: {
                top: 10,
                    bottom: 10,
                    left: 10,
                    right: 10
            }
        }
    }
}
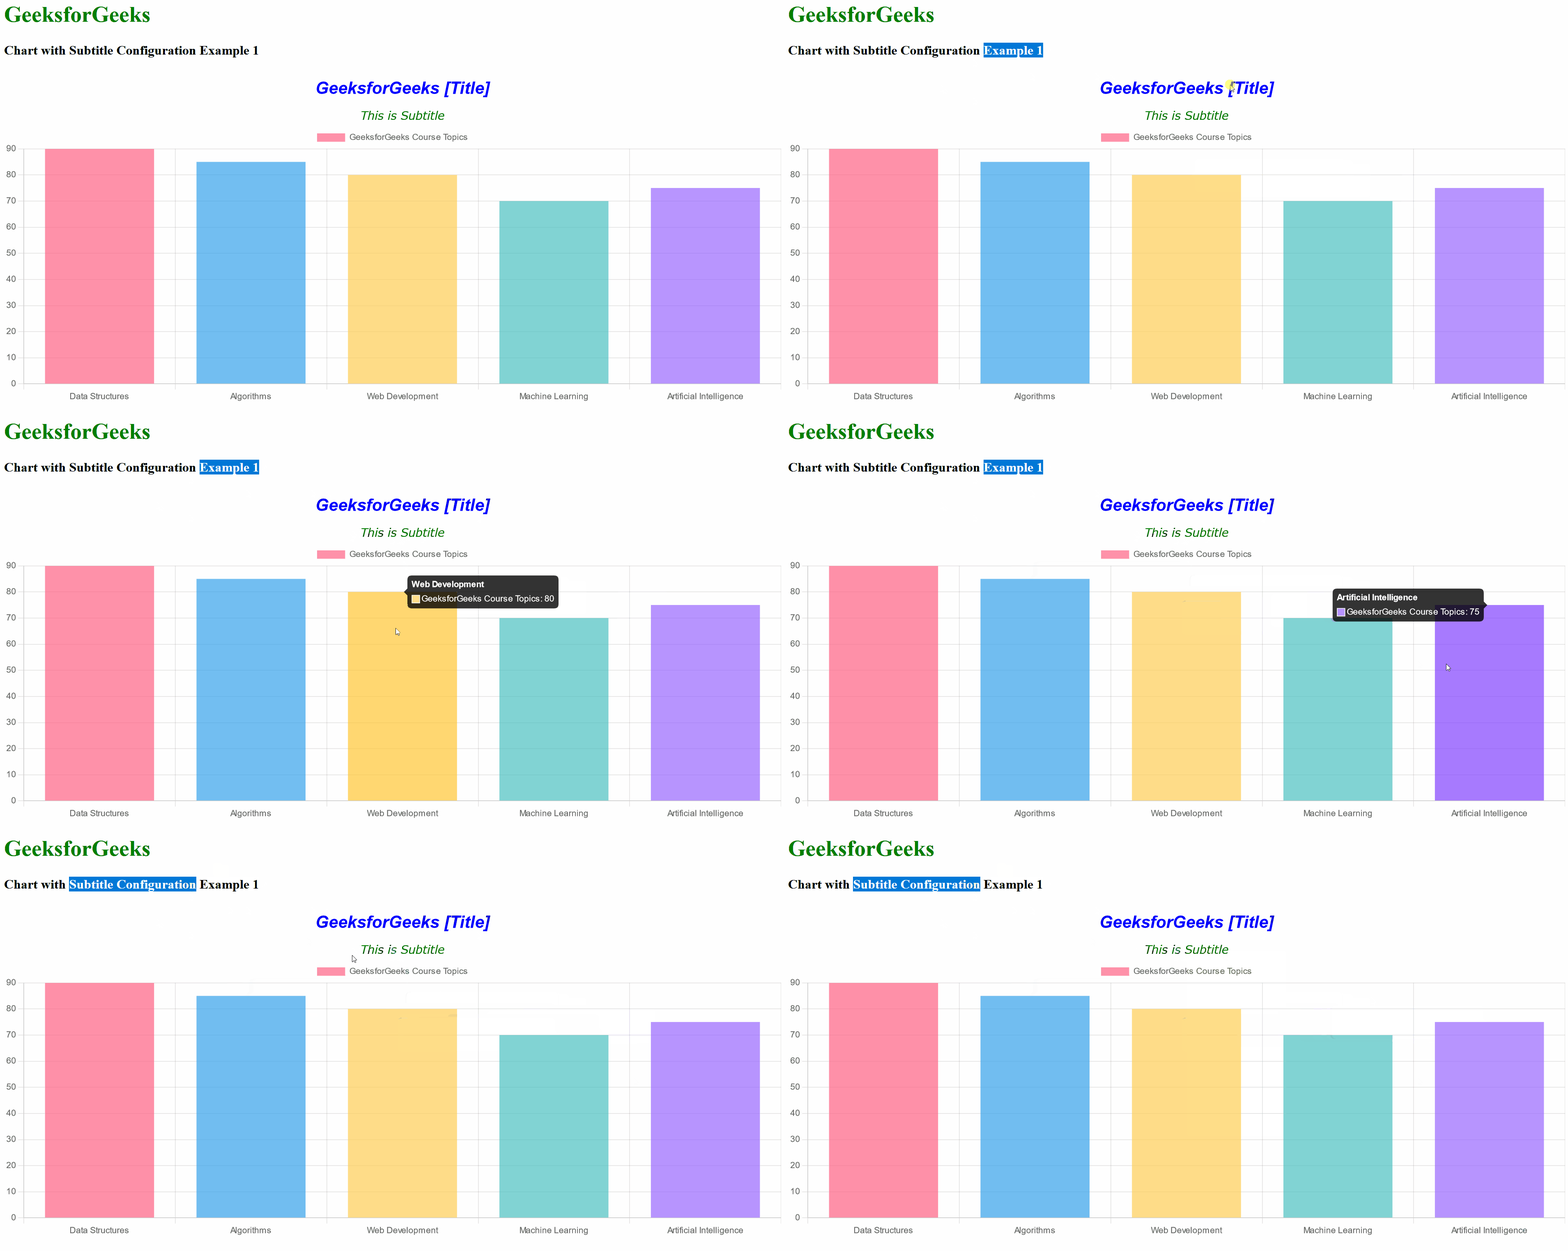
Example 1: In this example, we have defined the bar-type chart for the data of “GeeksforGeeks Course Topics”. We have denied the data along with the values. Here, we have specified the subtitle configuration, in which there are different customization options like text, color, size, font, family, and padding. By customizing these values we can make the subtitle more attractive.
HTML
<!DOCTYPE html>
<html>
<head>
<title>
GeeksforGeeks Chart with Subtitle
</title>
<script src=
</script>
<script src=
</script>
</head>
<body>
<h1 style="color:green;">
GeeksforGeeks
</h1>
<h3 style="color:black;">
Chart with Subtitle Configuration Example 1
</h3>
<canvas id="myChart"
width="700"
height="300">
</canvas>
<script>
var ctx =
document.getElementById('myChart').getContext('2d');
var myChart = new Chart(ctx, {
type: 'bar',
data: {
labels: ['Data Structures',
'Algorithms',
'Web Development',
'Machine Learning',
'Artificial Intelligence'],
datasets: [{
label: 'GeeksforGeeks Course Topics',
data: [90, 85, 80, 70, 75],
backgroundColor: [
'rgba(255, 99, 132, 0.7)',
'rgba(54, 162, 235, 0.7)',
'rgba(255, 206, 86, 0.7)',
'rgba(75, 192, 192, 0.7)',
'rgba(153, 102, 255, 0.7)'
]
}]
},
options: {
plugins: {
title: {
display: true,
text: 'GeeksforGeeks [Title]',
align: 'center',
color: 'blue',
fullSize: false,
position: 'top',
font: {
size: 24,
weight: 'bold',
family: 'Arial',
style: 'italic'
},
padding: {
top: 10,
bottom: 10,
left: 10,
right: 10
}
},
subtitle: {
display: true,
text: 'This is Subtitle',
align: 'left',
color: 'green',
fullSize: false,
position: 'top',
font: {
size: 16,
weight: 'normal',
family: 'Verdana',
style: 'italic'
},
padding: {
top: 5,
bottom: 5,
left: 5,
right: 5
}
}
}
}
});
</script>
</body>
</html>
|
Output

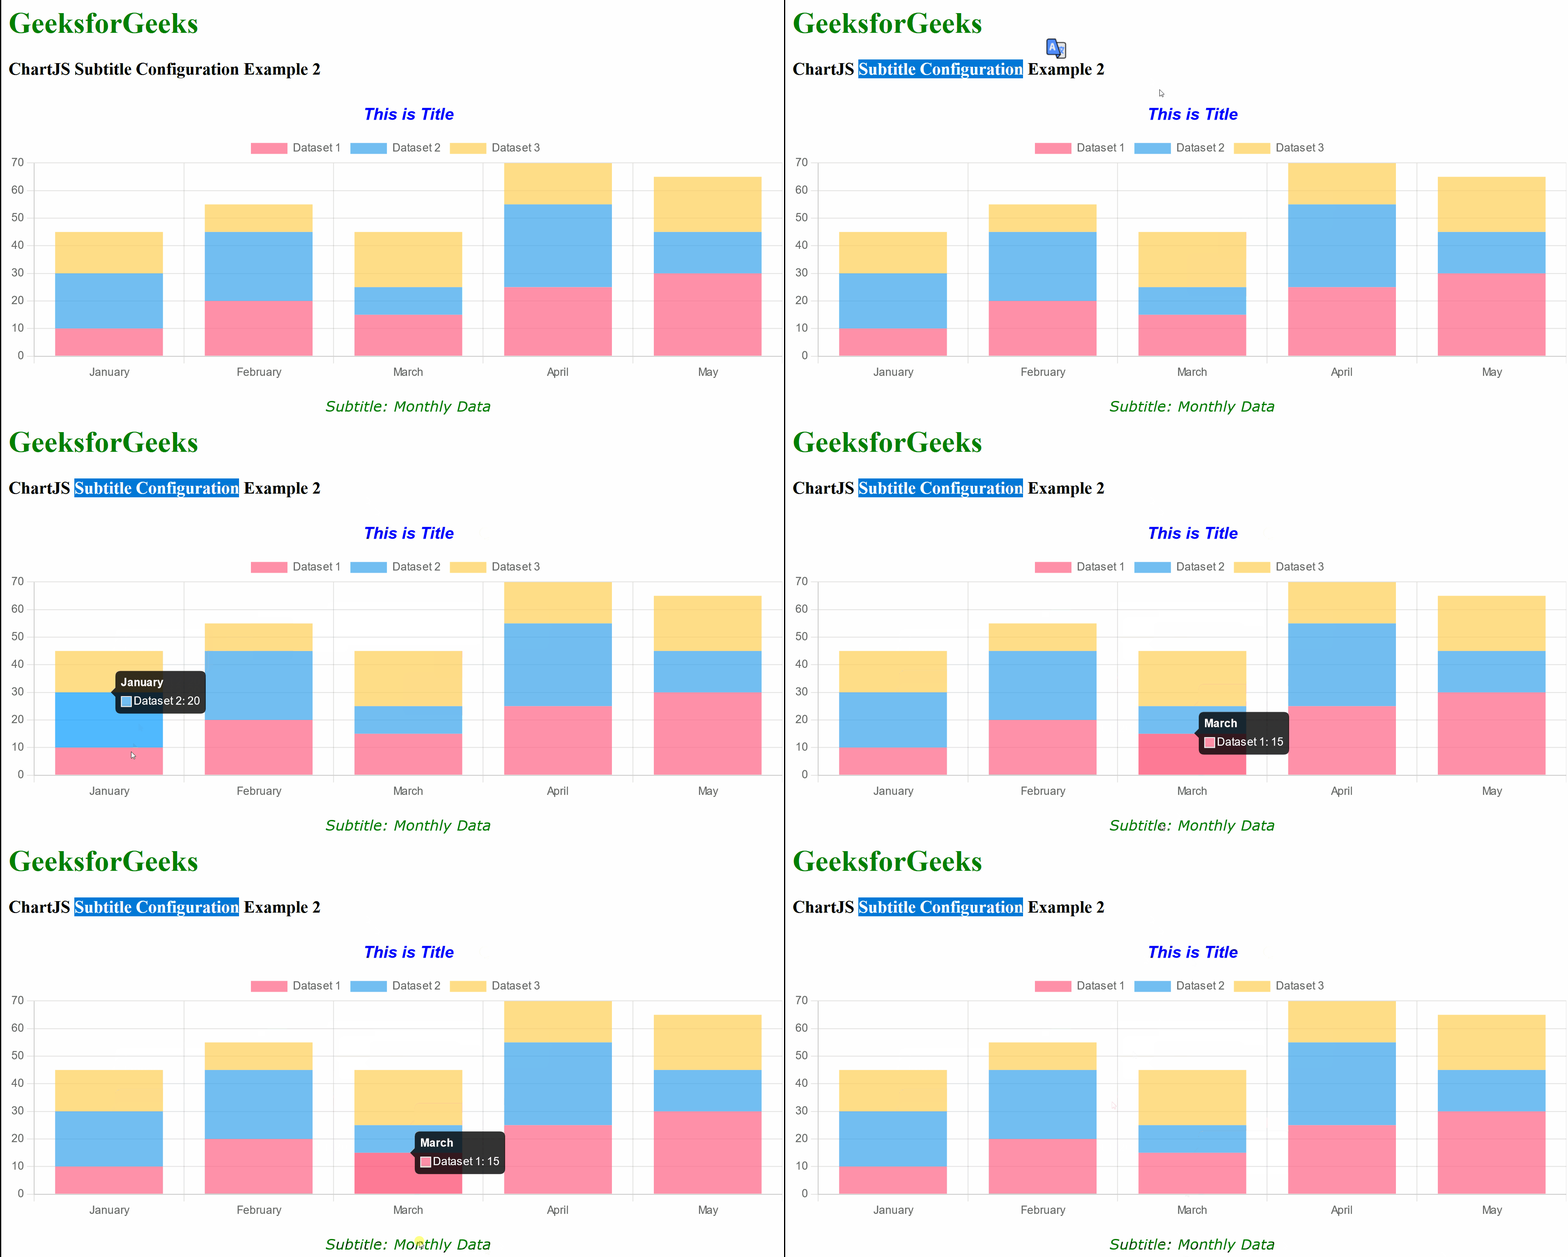
Example 2: In this example, we have a stacked chart of sample datasets. Here, we have defined the data for stacked chart representation. In the options property, we have specified the subtitle configuration, in which we have customized its sub-options like padding, position, etc. We can see that as compared to Example 1, the position of subtitle text is below the chart. So, this type of customization can be done using subtitle configuration.
HTML
<!DOCTYPE html>
<html>
<head>
<title>
Stacked Bar Chart with Subtitle Example
</title>
<script src=
</script>
<script src=
</script>
</head>
<body>
<h1 style="color:green;">
GeeksforGeeks
</h1>
<h3 style="color:black;">
ChartJS Subtitle Configuration Example 2
</h3>
<canvas id="myChart"
width="700"
height="300">
</canvas>
<script>
var ctx =
document.getElementById('myChart').getContext('2d');
var myChart = new Chart(ctx, {
type: 'bar',
data: {
labels: ['January',
'February',
'March',
'April',
'May'],
datasets: [
{
label: 'Dataset 1',
data: [10, 20, 15, 25, 30],
backgroundColor: 'rgba(255, 99, 132, 0.7)',
},
{
label: 'Dataset 2',
data: [20, 25, 10, 30, 15],
backgroundColor: 'rgba(54, 162, 235, 0.7)',
},
{
label: 'Dataset 3',
data: [15, 10, 20, 15, 20],
backgroundColor: 'rgba(255, 206, 86, 0.7)',
}
]
},
options: {
scales: {
x: {
stacked: true,
},
y: {
stacked: true,
beginAtZero: true,
}
},
plugins: {
title: {
display: true,
text: 'This is Title',
align: 'center',
color: 'blue',
fullSize: false,
position: 'top',
font: {
size: 18,
weight: 'bold',
family: 'Arial',
style: 'italic'
},
padding: {
top: 10,
bottom: 10,
left: 10,
right: 10
}
},
subtitle: {
display: true,
text: 'Subtitle: Monthly Data',
align: 'left',
color: 'green',
fullSize: false,
position: 'bottom',
font: {
size: 16,
weight: 'normal',
family: 'Verdana',
style: 'italic',
lineHeight: 1.5,
letterSpacing: '2px',
},
padding: {
top: 15,
bottom: 10,
left: 10,
right: 10
}
}
}
}
});
</script>
</body>
</html>
|
Output

Reference: https://www.chartjs.org/docs/latest/configuration/subtitle.html#subtitle-configuration
Share your thoughts in the comments
Please Login to comment...