Chart.js General Accessibility
Last Updated :
06 Dec, 2023
Chart.js General Accessibility ensures the accessibility rendered on user-provided canvas elements. Users can add accessibility features like ARIA attributes or fallback content within the canvas elements. This ensures that the content of the canvas, and chart information is accessible to all the user who relies on assistive technologies.
Accessible canvas elements
role="img": indicates that the canvas should be treated as an image, suitable for contexts where the canvas represents graphical content.aria-label: provides a text description of the content or purpose of the canvas, enhancing accessibility for users who rely on screen readers.
Syntax:
Using ARIA Attributes:
<canvas id="accessibleChart" width="400" height="200" aria-label="Chart Title" role="img"></canvas>
Using Internal Fallback Content:
<canvas id="accessibleChart" width="400" height="200">
  <p>Chart Title</p>
</canvas>
CDN link
<script src="https://ajax.googleapis.com/ajax/libs/jquery/3.6.1/jquery.min.js"></script>
<script src="https://cdnjs.cloudflare.com/ajax/libs/Chart.js/4.1.2/chart.umd.js"></script>
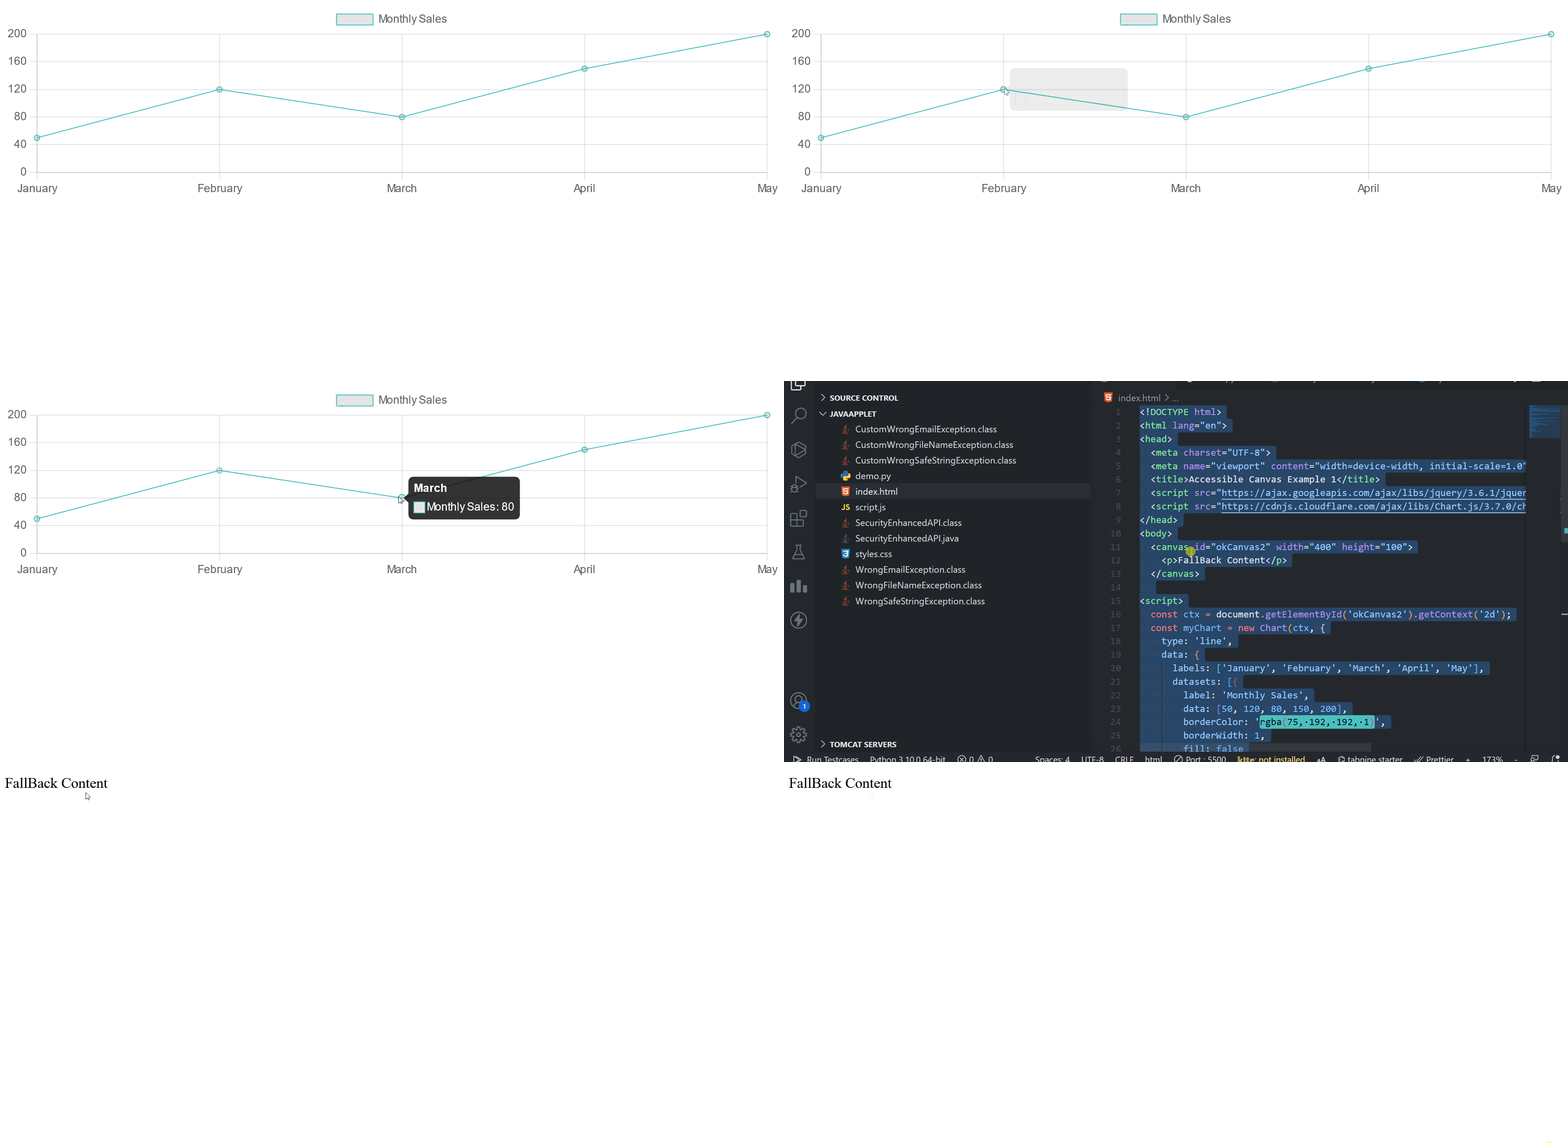
Example 1: The below example consists of text content as a fallback. If the canvas is not supported or loaded, the content inside the <p> element will be displayed. This ensures the proper content for the users who cannot interact with the canvas. We can see in the output that when the canvas was not loaded the accessibility message was shown.
HTML
<!DOCTYPE html>
<html lang="en">
<head>
<meta charset="UTF-8">
<meta name="viewport"
content="width=device-width,
initial-scale=1.0">
<title>Accessible Canvas Example 1</title>
<script src=
</script>
<script src=
</script>
</head>
<body>
<canvas id="okCanvas2"
width="400"
height="100">
<p>FallBack Content</p>
</canvas>
<script>
const ctx =
document.getElementById('okCanvas2').getContext('2d');
const myChart = new Chart(ctx, {
type: 'line',
data: {
labels: ['January',
'February',
'March',
'April', 'May'],
datasets: [{
label: 'Monthly Sales',
data: [50, 120, 80, 150, 200],
borderColor: 'rgba(75, 192, 192, 1)',
borderWidth: 1,
fill: false
}]
},
options: {
scales: {
y: {
beginAtZero: true
}
}
}
});
</script>
</body>
</html>
|
Output:

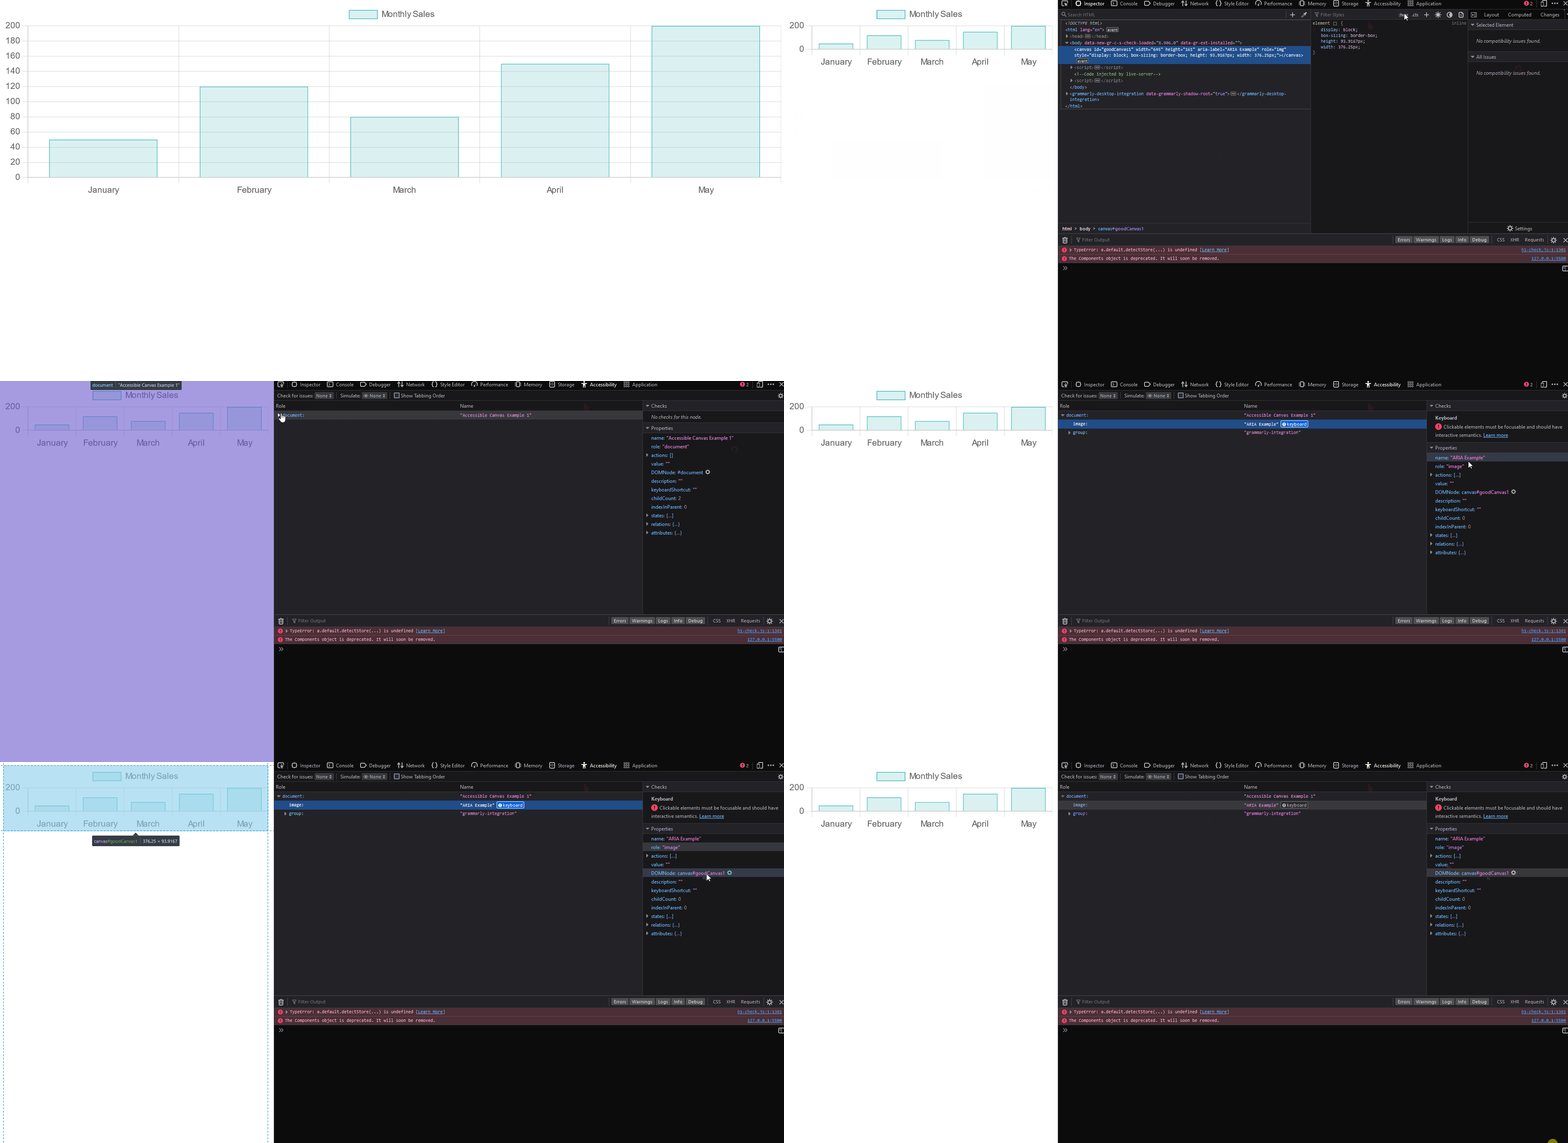
Example 2: In the below example, we have used the ARIA attribute as aria-label = ARIA Example. In the output, we can see that the accessibility of Canvas is set to ARIA Example and the role is img. When we will see the canvas element, we will see the label of ARIA Example on the canvas element.
HTML
<!DOCTYPE html>
<html lang="en">
<head>
<meta charset="UTF-8">
<meta name="viewport"
content="width=device-width,
initial-scale=1.0">
<title>Accessible Canvas Example 2</title>
<script src=
</script>
<script src=
</script>
</head>
<body>
<canvas id="goodCanvas1"
width="400"
height="100"
aria-label="ARIA Example"
role="img">
</canvas>
<script>
const ctx =
document.getElementById('goodCanvas1').getContext('2d');
const myChart = new Chart(ctx, {
type: 'bar',
data: {
labels: ['January',
'February',
'March',
'April', 'May'],
datasets: [{
label: 'Monthly Sales',
data: [50, 120, 80, 150, 200],
backgroundColor: 'rgba(75, 192, 192, 0.2)',
borderColor: 'rgba(75, 192, 192, 1)',
borderWidth: 1
}]
},
options: {
scales: {
y: {
beginAtZero: true
}
}
}
});
</script>
</body>
</html>
|
Output:

Share your thoughts in the comments
Please Login to comment...