Chart.js General Padding
Last Updated :
20 Nov, 2023
The empty area between the canvas’s edges and the chart elements is known as padding in Chart.js. It can be used to provide a border around the chart or to make sure that none of its components are placed too close to the canvas’ edges.
Padding can be applied in different formats as follows.
- Number: The padding value is a number that is applied to all sides (top, bottom, left, right).
- {top, left, right, bottom} object: The padding value is an object like the “right” property defines the right padding, the “left” property defines the left padding, and so on.
- {x, y} object: This padding value is a shorthand for defining left/right and top/bottom to the same values. If {x: 10px, y: 5px } defines left and right with 10px of padding and top and bottom having 5px of padding.
CDN Link:
<script src="https://cdn.jsdelivr.net/npm/chart.js@latest/dist/chart.min.js"></script>
<script src="https://cdn.jsdelivr.net/npm/chart.js"></script>
Syntax:
new Chart(chart, {
     type: "bar",
     data: {
          // labels and data
     },
    options: {
        layout: {
              padding: // add paddings
            },
        },
     },
});
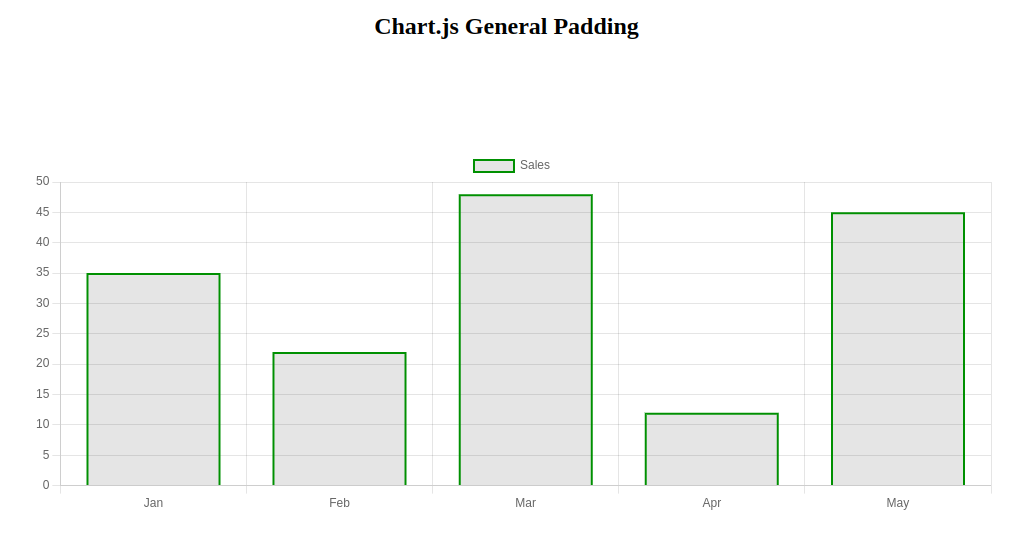
Example 1: In the below code, the chart has paddings in all four sides (spaces between the chart and HTML div container) like 40 pixels to left, 50 pixels to right, 90 pixels to top and 80 pixels to bottom of the chart. It demonstrates the {top, left, bottom, right} object padding.
An object containing the following properties makes up the padding property in Chart.js:
- top: The chart’s padding on the top side.
- left: The chart’s padding on the left-hand side.
- bottom: The chart’s padding on the bottom side.
- right: The chart’s padding on the right-hand side.
HTML
<!DOCTYPE html>
<html>
<head>
<title>Chart.js with Paddings</title>
<script src=
</script>
<script src=
</script>
<style>
body {
text-align: center;
}
.chart {
width: 80%;
margin: auto;
}
</style>
</head>
<body>
<h2>Chart.js General Padding</h2>
<div class="chart">
<canvas id="myTooltip"></canvas>
</div>
<script>
const chart = document.getElementById("myTooltip");
new Chart(chart, {
type: "bar",
data: {
labels: ["Jan", "Feb", "Mar", "Apr", "May"],
datasets: [
{
label: "Sales",
data: [35, 22, 48, 12, 45],
// Width of the line border
borderWidth: 2,
// Color of the line border
borderColor: "green",
},
],
},
options: {
layout: {
padding: {
left: 60,
right: 50,
top: 90,
bottom: 80,
},
},
plugins: {
tooltip: {
enabled: true,
},
},
},
});
</script>
</body>
</html>
|
Note: You can specify the padding values in terms of percentages of the canvas size or pixels.
Output:
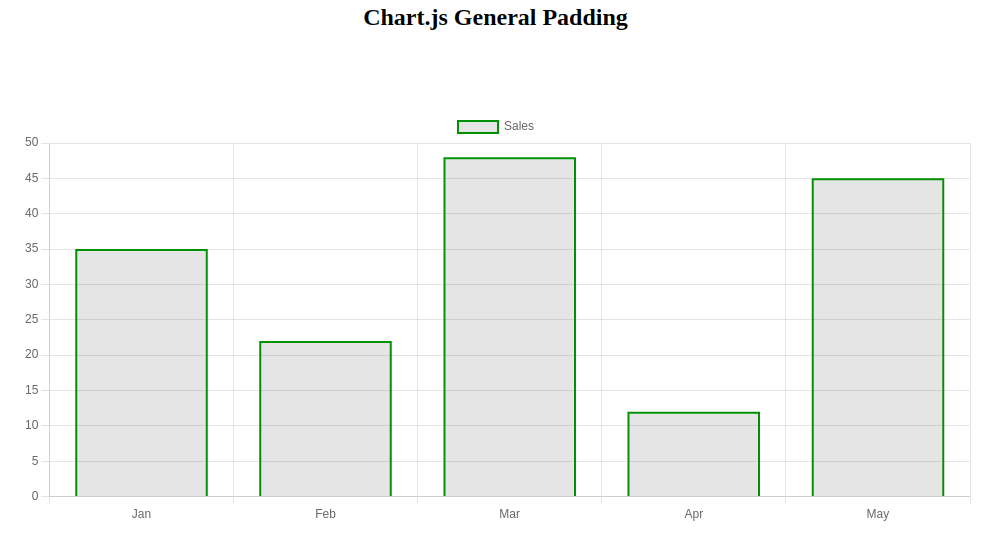
Example 2: The code shows padding equal to all the sides. The padding of 60 pixels has been added to all the sides (top, left, bottom, right) of the chart. (Adding spaces between the chart and HTML div container). It demonstrates the Number padding format.
HTML
<!DOCTYPE html>
<html>
<head>
<title>Chart.js with Paddings</title>
<script src=
</script>
<script src=
</script>
<style>
body {
text-align: center;
}
.chart {
width: 80%;
margin: auto;
}
</style>
</head>
<body>
<h2>Chart.js General Padding</h2>
<div class="chart">
<canvas id="myTooltip"></canvas>
</div>
<script>
const chart = document.getElementById("myTooltip");
new Chart(chart, {
type: "bar",
data: {
labels: ["Jan", "Feb", "Mar", "Apr", "May"],
datasets: [
{
label: "Sales",
data: [35, 22, 48, 12, 45],
// Width of the line border
borderWidth: 2,
// Color of the line border
borderColor: "green",
},
],
},
options: {
layout: {
padding: 60
},
plugins: {
tooltip: {
enabled: true,
},
},
},
});
</script>
</body>
</html>
|
Output:
Share your thoughts in the comments
Please Login to comment...