Chart.js General Data structures
Last Updated :
07 Dec, 2023
Chart.js General data structure is the backbone of chat.js or any other charting library, with the help of data structures we can determine how data is organized, manipulated, and finally displayed in the chats.
Syntax:
const chartConfig = {
  type: 'chartType',
  data: {
    datasets: [{ data: [dataValues] }],
    labels: ['label1', 'label2']
  },
  options: { /* chart options */ }
};
Different Types of Data Structures:
- Primitive Array: This structure uses an array of numbers for data points, each corresponding to a label.
- Object Array: Here, each data point is an object specifying x and y values, allowing for complex chart types like scatter plots.
- Object Array using Custom Properties: This format uses an array of objects with custom properties, providing flexibility in data representation and parsing
Dataset Configuration
- label: The label for the dataset which appears in the legend and tooltips.
- clip: Defines the clipping behavior for the chart area.
- order: Specifies the drawing order of datasets.
- stack: Configures stacking behavior for datasets in a bar or horizontal bar chart.
- parsing: Manages how data values are parsed.
- hidden: Controls the visibility of a dataset.
CDN link:
<script src="https://cdn.jsdelivr.net/npm/chart.js"></script>
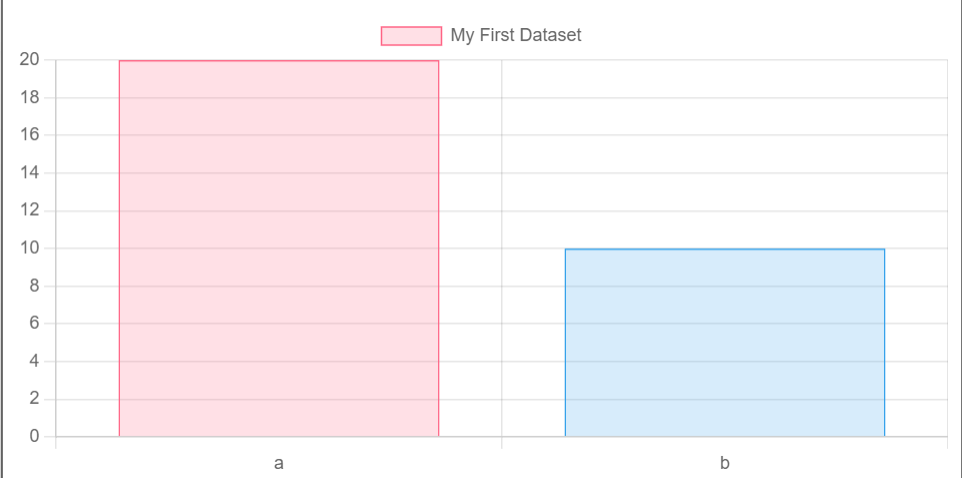
Example 1: In this example, we will using the primitive array type with Bar Chart, We will use the simple array of numbers for a bar chart.
HTML
<!DOCTYPE html>
<html lang="en">
<head>
<meta charset="UTF-8">
<meta name="viewport"
content="width=device-width,
initial-scale=1.0">
<title>Bar Chart Example with Chart.js</title>
<script src=
</script>
</head>
<body>
<canvas id="myChart"></canvas>
<script>
const cfg = {
type: 'bar',
data: {
labels: ['a', 'b'], // Labels should be here
datasets: [{
label: 'My First Dataset',
data: [20, 10],
backgroundColor:
['rgba(255, 99, 132, 0.2)',
'rgba(54, 162, 235, 0.2)'],
borderColor:
['rgba(255, 99, 132, 1)',
'rgba(54, 162, 235, 1)'],
borderWidth: 1
}]
},
options: {
scales: {
y: {
beginAtZero: true
}
}
}
};
const ctx = document.getElementById('myChart').getContext('2d');
const myChart = new Chart(ctx, cfg);
</script>
</body>
</html>
|
Output:
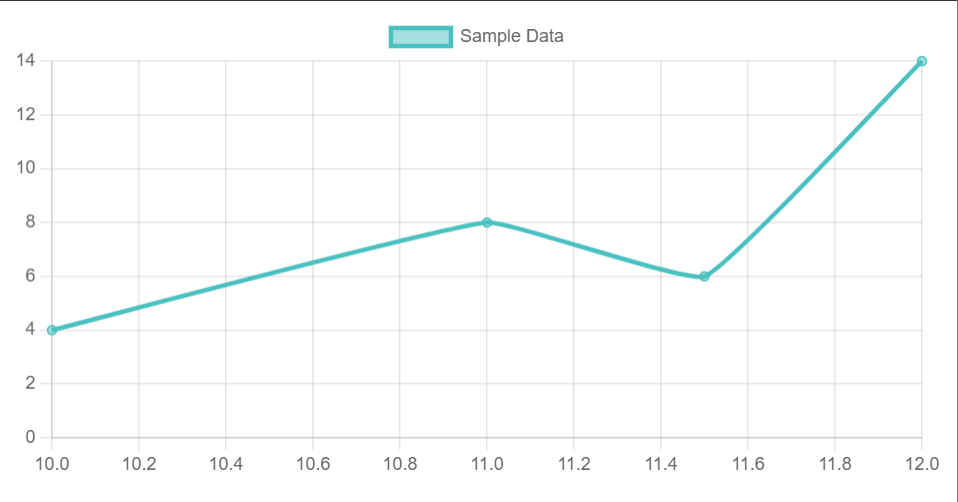
Example 2: This code creates an interactive line chart using Chart.js, displaying a dataset with points at specified x and y coordinates, enhanced with visual styling and a responsive legend.
HTML
<!DOCTYPE html>
<html lang="en">
<head>
<meta charset="UTF-8">
<meta name="viewport"
content="width=device-width,
initial-scale=1.0">
<title>Enhanced Line Chart Example with Chart.js</title>
<script src=
</script>
</head>
<body>
<canvas id="myLineChart"></canvas>
<script>
const cfg = {
type: 'line',
data: {
datasets: [{
label: 'Sample Data',
data:
[{ x: 10, y: 4 },
{ x: 11, y: 8 },
{ x: 11.5, y: 6 },
{ x: 12, y: 14 }],
backgroundColor: 'rgba(75, 192, 192, 0.5)',
borderColor: 'rgba(75, 192, 192, 1)',
fill: false,
tension: 0.1
}]
},
options: {
scales: {
x: {
type: 'linear',
position: 'bottom'
},
y: {
beginAtZero: true
}
},
plugins: {
legend: {
display: true
}
}
}
};
const ctx =
document.getElementById('myLineChart')
.getContext('2d');
new Chart(ctx, cfg);
</script>
</body>
</html>
|
Output:
Share your thoughts in the comments
Please Login to comment...