Calculate Percentiles For Data Frame Columns Using R
Last Updated :
02 Apr, 2024
In Data analysis understanding the distribution of values within a dataset is a must. Calculating percentiles is a crucial step in this process, providing insights into the spread and central tendency of numerical data. In R Programming Language we can leverage various functions to calculate percentiles for DataFrame columns. Here we cover the necessary concepts and provide practical examples with code.
What is Percentile?
By dividing a dataset into 100 equal pieces, percentiles are statistical measurements that show where a given value falls within the distribution. The pth percentile is the value below which p% of the data falls. Common percentiles include the median (50th percentile), quartiles (25th, 50th, and 75th percentiles), and deciles (10th, 20th, …, 90th percentiles).
Syntax: quantile( data, probs)
- data: data whose percentiles are to be calculated
- probs: percentile value
R
# Sample data
data <- c(10, 15, 20, 25, 30, 35, 40, 45, 50)

# Calculate 25th, 50th, and 75th percentiles
percentiles <- quantile(data, probs = c(0.25, 0.5, 0.75))

# Display the results
print(percentiles)
Output:
25% 50% 75%
 20  30  40
How to calculate percentiles for dataframe columns
Syntax: apply( dataframe, function)
First we will create a dataset to calculate percentile.
R
# Sample DataFrame
student_data <- data.frame(
  Student_ID = c(1, 2, 3, 4, 5),
  Math_Score = c(85, 92, 78, 88, 95),
  English_Score = c(90, 85, 88, 92, 80)
)

# Display the original DataFrame
print("Original DataFrame:")
print(student_data)
Output:
[1] "Original DataFrame:"

  Student_ID Math_Score English_Score
1          1         85            90
2          2         92            85
3          3         78            88
4          4         88            92
5          5         95            80
Now we will Calculate Percentiles
R
# Calculate percentiles for Math and English scores
math_percentiles <- quantile(student_data$Math_Score, probs = c(0.25, 0.5, 0.75))
english_percentiles <- quantile(student_data$English_Score, probs = c(0.25, 0.5, 0.75))

# Display the results
cat("\nMath Score Percentiles:\n")
print(math_percentiles)

cat("\nEnglish Score Percentiles:\n")
print(english_percentiles)
Output:
Math Score Percentiles:
25% 50% 75%
 85  88  92

English Score Percentiles:
25% 50% 75%
 85  88  90
Visualizing the percentiles results
R
# Combine both boxplots into one frame
par(mfrow = c(1, 2))

# Boxplot for Math scores
boxplot(student_data$Math_Score, main = "Math Score Distribution",
        ylab = "Math Score", names = c("Math"), col = "lightblue")

# Add horizontal lines for percentiles
abline(h = math_percentiles, col = c("red", "blue", "red"), lty = 2)

# Boxplot for English scores
boxplot(student_data$English_Score, main = "English Score Distribution",
        ylab = "English Score", names = c("English"), col = "lightgreen")

# Add horizontal lines for percentiles
abline(h = english_percentiles, col = c("red", "blue", "red"), lty = 2)

# Reset the plotting layout
par(mfrow = c(1, 1))
Output:
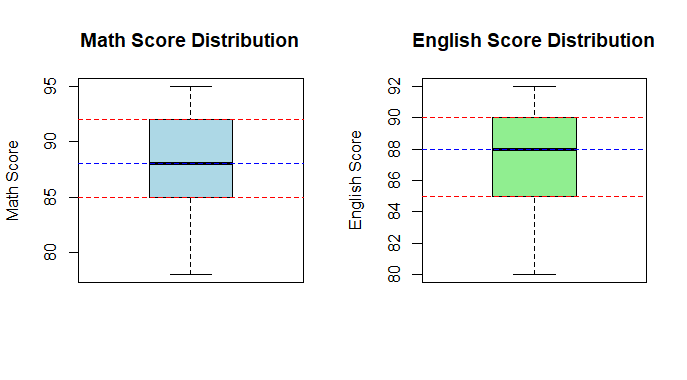
Calculate percentiles for dataframe columns
Now we perform all the tasks on iris dataset to Calculate percentiles.
R
# Load the iris dataset
data(iris)

# Calculate percentiles for each numerical column using apply
percentiles <- apply(iris[, 1:4], 2, quantile, probs = c(0.25, 0.5, 0.75))

# Print the results
print("Percentiles for Sepal.Length, Sepal.Width, Petal.Length, and Petal.Width:")
print(percentiles)
Output:
[1] "Percentiles for Sepal.Length, Sepal.Width, Petal.Length, and Petal.Width:"
    Sepal.Length Sepal.Width Petal.Length Petal.Width
25%          5.1         2.8         1.60         0.3
50%          5.8         3.0         4.35         1.3
75%          6.4         3.3         5.10         1.8
Visualizing Percentiles
R
# Calculate percentiles for each numerical column using apply
percentiles <- apply(iris[, 1:4], 2, quantile, probs = c(0.25, 0.5, 0.75))

# Create boxplots for each numerical column
par(mfrow = c(2, 2))  # Set up a 2x2 grid for subplots

for (i in 1:4) {
  boxplot(iris[, i], main = names(iris)[i], ylab = names(iris)[i],
          col = "lightblue", border = "black")

  # Add horizontal lines for percentiles
  abline(h = percentiles[, i], col = c("red", "blue", "red"), lty = 2)
}

# Reset the plotting layout
par(mfrow = c(1, 1))
Output:
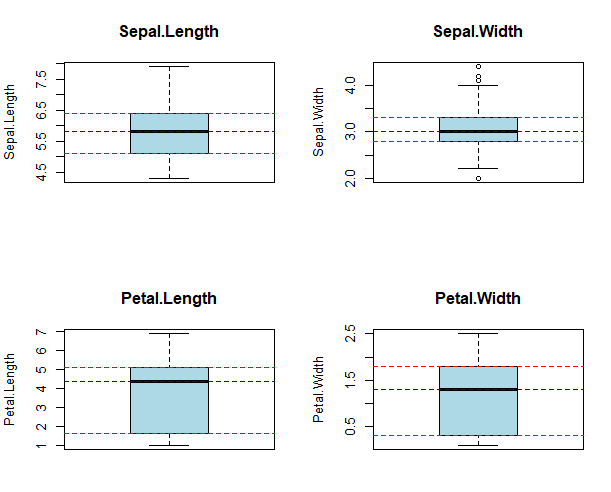
Visualizing Percentiles in Boxplot
Conclusion
Understanding data distribution is crucial in data analysis, and percentiles provide valuable insights. In R, using the quantile function simplifies percentile calculations for DataFrame columns. Whether it’s the median, quantiles, or other percentiles, R’s syntax is clear and efficient.
Share your thoughts in the comments
Please Login to comment...