Acceleration is the change of velocity with time. In real life scenario acceleration also changes with time. For example, you are travelling from one city to another city by road. Then in this case you will accelerate more in case of empty road and will accelerate down in case of traffic. This change of acceleration can be observed by plotting acceleration against time in a graph. This called acceleration time graph. In this article, we will learn in detail about acceleration time graph and solve problems based on it.
What is Acceleration Time Graph?
An acceleration-time graph is used to depict the relationship between acceleration and time, where acceleration is an independent variable plotted on the Y-axis, and time is a dependent variable plotted on the X-axis. It is obtained when the data of acceleration and time obtained is plotted on a rectangular graph while studying the motion of a body. We can determine the change in velocity in a given interval of time with the help of an acceleration-time graph. By determining the area under the curve of the acceleration-time graph, we can find the change in velocity of an object in motion over a certain period.
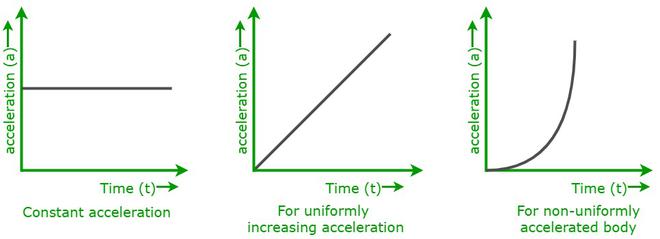
The graphs shown above are acceleration-time graphs for various types of body motion.
- When a body is moving with constant acceleration,
- When a body is moving uniformly with increasing acceleration.
- When a body is moving non-uniformly with variable acceleration.
Conclusions
The following are the points concluded from the acceleration-time graphs.
- The slope of the acceleration-time graph is △a/△t.
- The area under the acceleration-time graph represents the change in velocity.
Let,
△v be the change in velocity,
△a be the change in acceleration,
△t be the change in time.
Now, the area under the curve = △v
We know that the acceleration of a body is referred to as the rate of the change in velocity in a given period of time.
So,
△a = △v/△t
Now, by multiplying with △t on both sides, we get,
△v = △a × △t (which is area under the curve in acceleration-time graph)
- For an object moving with constant acceleration, i.e., acceleration is the same at all intervals of time. Hence, the slope of the acceleration-time graph is zero, and the graph will be parallel to the time axis.
Acceleration vs Retardation
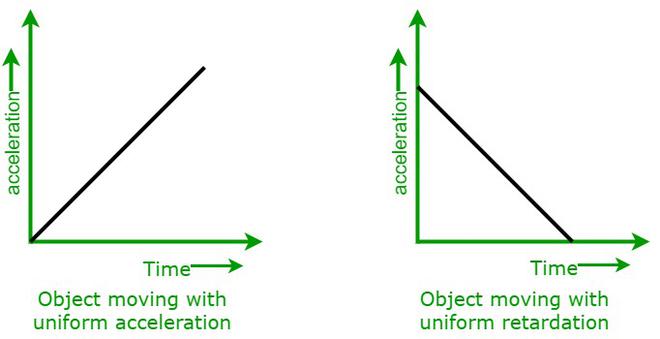
Acceleration: Acceleration of a body is referred to as the rate of the change in velocity in a given period of time. It is a vector quantity and is measured in terms of m/s2.
Acceleration = Change in velocity/time
here, change in velocity is positive.
Let us assume that a body that is traveling at a uniform velocity increases its speed. The rate of increase in speed is referred to as the acceleration of a body. Let “u” be the initial velocity, “v” be the final velocity, and “t” be the time interval, then the acceleration of the body is given as,
Acceleration (a) = (v – u)/t
Example: An example of acceleration in everyday life is turning a car at a corner. The velocity of the car increases as the direction changes, which results in acceleration. The acceleration increases with increasing turn speed.
Retardation: Retardation of a body is referred to as the rate of the change in velocity in a given period of time. Retardation means negative acceleration.
Retardation = Change in velocity/time
here, change in velocity is negative.
Let us assume that a body that is traveling at a uniform velocity decreases its velocity. The rate of decrease in velocity is referred to as the retardation of a body. Let “u” be the initial velocity, “v” be the final velocity, and “t” be the time interval, then the retardation of the body is given as,
Retardation = (v – u)/t
Example: A real-life example of retardation is turning off a fan. When the switch of moving fan is switched off, the fan blades’ rate of rotation progressively slows down. This rate of reduction in the velocity of the fan is known as retardation.
Also Check This:
Sample Problems on Acceleration Time Graphs
Problem 1: From the acceleration vs time graph given below, determine the change in velocity.

Solution:
To find the change in velocity of the body we need to determine the area under the curve.
So, to find the change in the velocity of the object, we need to calculate the area of the triangle.
△v = area of triangle
= ½ × 25 × 6
△v = 75 m/s.
Hence, the change in velocity is 75 m/s.
Problem 2: From the acceleration vs time graph given below, find the initial velocity of a body if its final velocity is 55 m/sec.
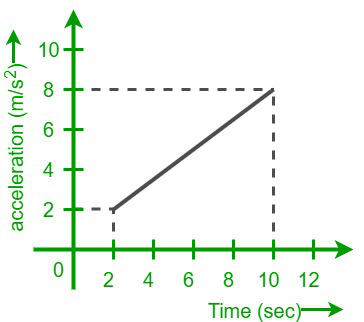
Solution:
To find the change in velocity of the body we need to determine the area under the curve. From the graph, we can observe that it has a rectangle and a triangle. So, to find the change in the velocity of the object, we need to calculate the area of these figures.
△v = area of triangle + area of rectangle
= ½ × 8 × 6 + 2 × 8
△v = 24 + 16 = 42 m/s
We know that,
△v = final velocity – initial velocity
42 = 55 – vi
vi = 55 – 42 = 13 m/s
Hence, the initial velocity is 13 m/s.
Problem 3: From the acceleration vs time graph given below, determine the velocity at t = 6 sec, if v(0) = 0.

Solution:
Acceleration is given by;
a = dv/dt
⇒ dv = (a)dt
By integrating on both sides, we get
∫dv = ∫(a) dt
⇒ v = ∫(1.5) dt
⇒ v(t) = 1.5t + c, where c is a constant
⇒ v(0) = 0
⇒ c = 0
Now, v(t) = 1.5t
v(6) = 1.5 × 6 = 9 m/s
Hence, the velocity at t = 6 sec is 9 m/s.
Problem 4: What does the area under the acceleration-time graph indicate?
Solution:
The area under the acceleration-time graph represents the change in velocity.
Let △v be the change in velocity, △a be the change in acceleration, and △t be the change in time.
Now, the area under the curve = △v
We know that the acceleration of a body is referred to as the ratio of the change in velocity in a given period of time.
So,
△a = △v/△t
Now, by multiplying with △t on both sides, we get,
△v = △a × △t
So, the area under the curve is obtained by multiplying the change in acceleration and change in time.
Problem 5: What does a jerk in the acceleration time graph mean?
Solution:
A jerk is the sudden change in the acceleration of the moving body, and the slope of the a-t graph represents jerk.
The slope of the acceleration-time graph = jerk = △a/△t
Acceleration Time Graph – FAQs
What is an acceleration-time graph?
An acceleration-time graph displays how acceleration varies over time for an object moving in a straight line. It plots acceleration on the y-axis against time on the x-axis.
How do you calculate the area under an acceleration-time graph and what does it represent?
The area under an acceleration-time graph represents the change in velocity over the time period covered by the graph. To calculate this area, you would typically sum the areas of the rectangles or trapezoids that fit under the curve, which correspond to distinct intervals of time during which the acceleration is constant.
Can you determine the velocity of an object at a specific time from an acceleration-time graph?
Directly determining the instantaneous velocity at a specific time from an acceleration-time graph is not possible. However, you can calculate the change in velocity over a time period by finding the area under the graph within that period. Knowing the initial velocity allows you to determine the final velocity.
What does a negative acceleration indicate on this type of graph?
Negative acceleration on an acceleration-time graph indicates deceleration, where the speed of the object decreases if the object is moving in the positive direction. If the object is moving in a direction considered negative, then a negative acceleration implies an increase in speed.
How can you find average acceleration from an acceleration-time graph?
Average acceleration can be determined by finding the total change in velocity (summing the areas under the curve, accounting for direction) and dividing it by the total time interval. Visually, this can be represented as a rectangle whose area is equivalent to the total area under the acceleration-time graph.
What does the slope of an acceleration-time graph represent?
The slope of an acceleration-time graph indicates the rate of change of acceleration over time, which is known as jerk. A steep slope implies a rapid change in acceleration.
How do you represent a body at rest on an acceleration-time graph?
A body at rest or moving with constant velocity is represented on an acceleration-time graph by a line along the time axis at zero acceleration.
How do you interpret an acceleration-time graph?
The slope of an acceleration-time graph represents the rate of change of the acceleration where a steeper slope indicates a higher rate of change.
What does the area under an acceleration-time graph represent?
The area under the curve on an acceleration-time graph represents the change in velocity of object. Specifically, it represents the final velocity minus the initial velocity.
Share your thoughts in the comments
Please Login to comment...