Distance-Time Graphs
Last Updated :
03 Jul, 2022
A distance-time graph is a graphical representation of how far a body has traveled in a specified amount of time. It is used to depict the relationship between distance and time, where distance is plotted on the Y-axis and time is plotted on the X-axis. Let’s first learn the importance of distance-time graphs.
Importance of distance-time graphs
Distance-time graphs help to study the motion of bodies. A distance-time graph shows how far someone or something has traveled and how long it took them/it to travel that distance. A distance-time graph is obtained when the data of distance and time obtained while studying the motion of a body is plotted on a rectangular graph.
Distance-time graphs
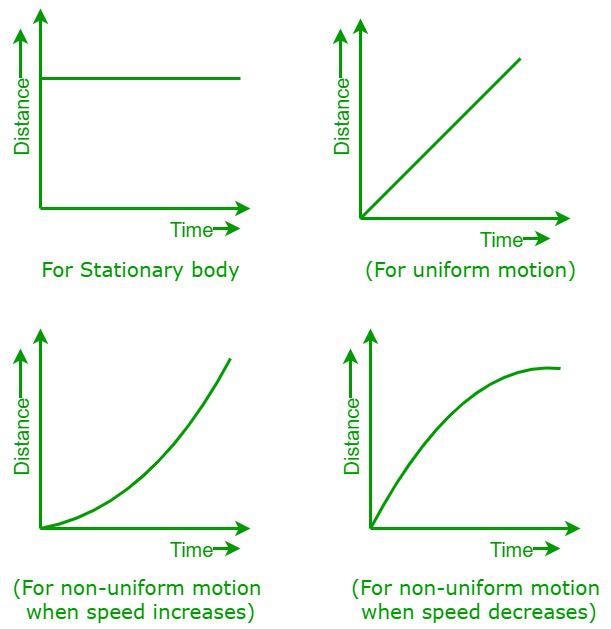
The graphs shown above are distance-time graphs for various types of body motion.
- When a body is steady or stationary,
- When a body is moving at a uniform speed,
- When a body is moving non-uniformly with increasing speed, and
- When a body is moving non-uniformly with decreasing speed.
Distance-time graph
Conclusions
The following are the points concluded from the distance-time graphs.
- When a body is at rest, then the graph is parallel to the axis where time is plotted.
- When the motion of a body is uniform, then the distance-time graph is a straight line.
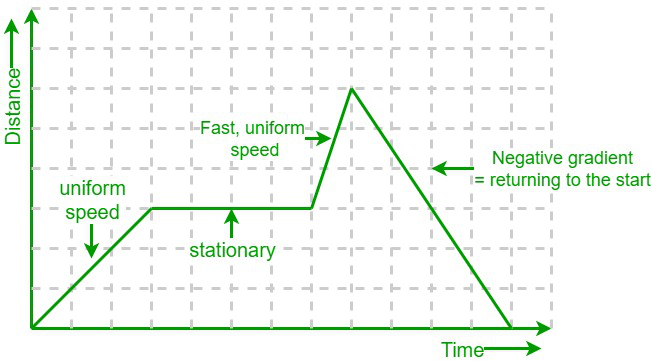
- The slope of the distance-time graph is equal to the speed of the body.
- The slope of the straight-line graph is constant regardless of the chosen interval. This implies that an object moving uniformly will always move at the same speed.
- The speed increases as the graph become steeper.
- A negative gradient or slope means the body is returning to the starting point.
Sample Problems
Problem 1: The graph below describes the journey of a man. Determine the speed of the man for each part of the journey.
Solution:
From the given graph, we can conclude that,
- Part a: From 10:00 to 11:30, the man traveled 15 km from the starting point in 1.5 hours.
- Part b: From 11:30 to 13:30, the man is at rest, so the distance remains the same.
- Part c: From 13:00 to 14:30, the man traveled the 15 km back to where they began in 1 hr.
- The speed at part a: Speed = 15/1.5 = 10 km/h
- The speed at part b: Speed = 0/2 = 0 km/h (not moving)
- The speed at part c: Speed = 15/1 = 15 km/hr
Problem 2: Jay is going for a drive in his car. The distance-time graph given below describes his full journey. Calculate his total distance traveled during his journey, as well as his average speed between 4:30 and 5:30.
Solution:
Jay traveled 30 km away from his home and then stopped for a while. He again drove 20 km and stopped briefly. He then traveled 50 km back home.
So, the total distance traveled by Jay = 30 km + 20 km + 50 km = 100km.
From the axis, we can observe that two big squares total 30 minutes. Hence, one big square is worth 15 minutes. From 4:30 to 4:45, Jay is at rest.
So, his speed between 4:30 and 4:45 = 0/0.25 = 0 km/h.
To calculate the average speed of Jay between 4:30 and 5:30, we need to calculate the slope of the graph between 4:45 and 5:00. This period lasted for 15 minutes, which is equivalent to 0.25 hours – this is the “change in x”. During this period, he increased his distance from home from 30 km up to 50 km. That means he traveled 20 km in total – this is the “change in y”.
So, we get, slope = 20/0.25 = 80 km/h.
Hence, the average speed = (0 + 80)/2 = 40 km/h
Problem 3: Construct a distance-time graph from the description of Uma’s journey given below. Uma left her home at 17:00 and, after traveling at a constant speed for an hour, she had covered 28 kilometers before stopping. After half an hour of being stopped, she drove home at a constant speed, and it took her an hour and a half in total to reach home.
Solution:
From the given data, we conclude that,
- From 17:00 to 18:00, Uma travels from 0 km away to 28 km away;
- From 18:00 to 18:30, she is at rest.
- From 18:30 to 20:00, she travels from 28 km away to 0 km away.
The final graph looks like this,
Problem 4: Every morning, Shubham walks from his home to the bus stop nearby, which is 750 meters away from his home. The below graph shows his journey on one particular day. Calculate his average speed from 0 sec to 40 sec and from 50 sec to 110 sec.
Solution:
To calculate the average speed of Shubam from 0 sec to 40 sec, we need to calculate the slope of the graph from 0 sec to 40 sec. This period lasted for 40 seconds – this is the “change in x”. During this period, he increased his distance from home from 0 m to 300 m. That means he traveled 300m in total – this is the “change in y”.
So, we get, slope = change in y/change in x = 300/40 = 7.5 m/s.
Thus, Shubham’s average speed from 0 to 40 sec is 7.5 m/s.
Now, to calculate the average speed of Shubam from 50 sec to 110 sec, we need to calculate the slope of the graph from 50 sec to 110 sec. This period lasted for 60 seconds – this is the “change in x”. During this period, he increased his distance from home from 200 m to 700 m. That means he traveled 500m in total – this is the “change in y”.
So, slope = 500/60 = 8.34 m/s.
Hence, Shubham’s average speed from 50 to 110 sec is 8.34 m/s.
Problem 5: A tourist bus journey on a day trip to the coast is recorded. Now, calculate the maximum speed of the bus throughout the trip and also how long the bus was stationary.
Solution:
The slope (or) gradient of a distance-time graph is the speed. Therefore, to calculate the fastest average speed, we must find the steepest section of the graph.
The bus traveled at maximum speed from 15:00 to 15:30. It covered 30 km in half an hour.
So, the maximum speed of the bus = 30/(0.5) = 60 km/hr.
The bus stopped for 30 minutes at the 40 km mark.
Like Article
Suggest improvement
Share your thoughts in the comments
Please Login to comment...