Stock Market Historical Data Visualization using React and API
Last Updated :
13 Feb, 2024
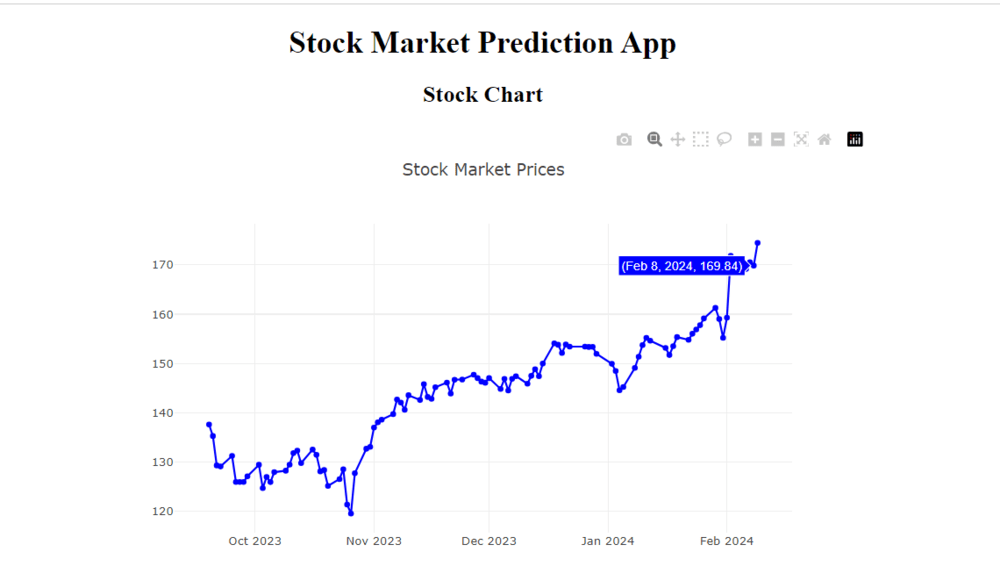
We’ll walk through the process of building a Stock Market Historical Data Visualization App. In this article, we’ll explore how to develop a simple app using React and the Alpha Vantage API. This app will allow users to view historical stock data for a selected company i.e: Amazon and visualize it in a line chart.
Preview of final output: Let us have a look at how the final output will look like.
Prerequisites:
Approach:
- Setting Up the React Application: Create a new React application using Create React App or your preferred method.
- Integrating the Alpha Vantage API: Obtain an API key from the Alpha Vantage website and use Axios to make HTTP requests to fetch stock market data.
- Displaying Real-time Stock Data: Build components to display real-time stock prices and trading volumes for selected companies.
- Visualizing Historical Stock Data: Develop components to visualize historical stock prices using line charts or candlestick charts.
Steps to Create the Project:
Step 1: Set up a new React.js project using creat-react-app.
npx create-react-app <<project-name>>
cd <<project-name>>
Step 2: Create an account on Alpha Vantage.
Step 3: Then you will be directed to API Documentation page, Choose the API URL from there and copy it
Step 4: You can create the API Key using the link given in the documentation, Get your API Key, and Copy the API Key.
Step 5: Install the Axios for making requests to APIs.
npm install axios
Step 6: Install plolty.js for Visualizing the data.
npm install react-plotly.js plotly.js
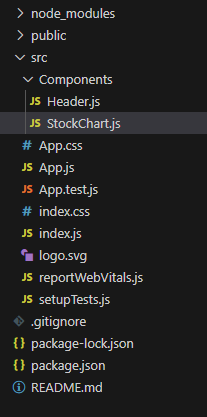
Project Structure:
The updated dependencies in package.json file will look like:
"dependencies": {
   "@testing-library/jest-dom": "^5.17.0",
   "@testing-library/react": "^13.4.0",
   "@testing-library/user-event": "^13.5.0",
   "axios": "^1.6.7",
   "plotly.js": "^2.29.0",
   "react": "^18.2.0",
   "react-dom": "^18.2.0",
   "react-plotly.js": "^2.6.0",
   "react-scripts": "5.0.1",
   "web-vitals": "^2.1.4"
}
Example: Modify the following code to create the Stock Market Historical Data Visualization App:
Javascript
import React from 'react';
import Header from './Components/Header';
import StockChart from './Components/StockChart';
function App() {
return (
<div>
<Header />
<StockChart />
</div>
);
}
export default App;
|
Javascript
import React from 'react';
function Header() {
return (
<center>
<h1>Stock Market Prediction App</h1>
</center>
);
}
export default Header;
|
Javascript
import React,
{
useState,
useEffect
} from 'react';
import Plot
from 'react-plotly.js';
import axios from 'axios';
function StockChart() {
const [stockData, setStockData] = useState({});
useEffect(() => {
const fetchStockData = async () => {
try {
const API_KEY = '72J5266S0H2QL30G';
let StockSymbol = 'AMZN';
const response = await axios.get(
`https:
);
setStockData(
response.data['Time Series (Daily)']
);
} catch (error) {
console.error('Error fetching stock data:', error);
}
};
fetchStockData();
}, []);
const dates =
stockData ? Object.keys(stockData) : [];
const closingPrices =
dates.map(
date =>
parseFloat(
stockData[date]['4. close'] || 0
)
);
return (
<center>
<h2>Stock Chart</h2>
<Plot
data={[
{
x: dates,
y: closingPrices,
type: 'scatter',
mode: 'lines+markers',
marker: { color: 'blue' },
}
]}
layout={
{
width: 800,
height: 500,
title: 'Stock Market Prices'
}
}
/>
</center>
);
}
export default StockChart;
|
Steps to start the App:
npm start
Output:
Output
Share your thoughts in the comments
Please Login to comment...