sciPy stats.histogram() function | Python
Last Updated :
13 Feb, 2019
scipy.stats.histogram(a, numbins, defaultreallimits, weights, printextras) works to segregate the range into several bins and then returns the number of instances in each bin. This function is used to build the histogram.
Parameters :
arr : [array_like] input array.
numbins : [int] number of bins to use for the histogram. [Default = 10]
defaultlimits : (lower, upper) range of the histogram.
weights : [array_like] weights for each array element.
printextras : [array_like] to print the no, if extra points to the standard output, if true
Results :
– cumulative frequency binned values
– width of each bin
– lower real limit
– extra points.
Code #1:
import scipy
import numpy as np
import matplotlib.pyplot as plt
hist, bin_edges = scipy.histogram([1, 1, 2, 2, 2, 2, 3],
bins = range(5))
print ("No. of points in each bin : ", hist)
print ("Size of the bins : ", bin_edges)
plt.bar(bin_edges[:-1], hist, width = 1)
plt.xlim(min(bin_edges), max(bin_edges))
plt.show()
|
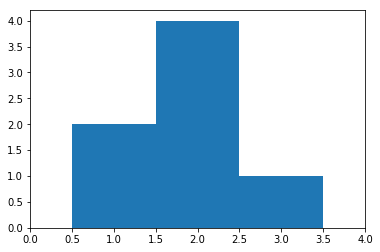
Output :
No. of points in each bin :  [0 2 4 1]
Size of the bins          :  [0 1 2 3 4]
Share your thoughts in the comments
Please Login to comment...