Range is a fundamental statistical concept that helps us understand the spread or variability of data within a dataset. Range in Statistics provides valuable insights into the extent of variation among the values in a dataset. Range quantifies the difference between the highest and lowest values in the dataset.
Range in Statistics
In this article, we will learn the definition, application, calculation, and constraints of range in statistics. Let’s start learning about range with a clear definition of range in statistics and range applications.
What is Range?
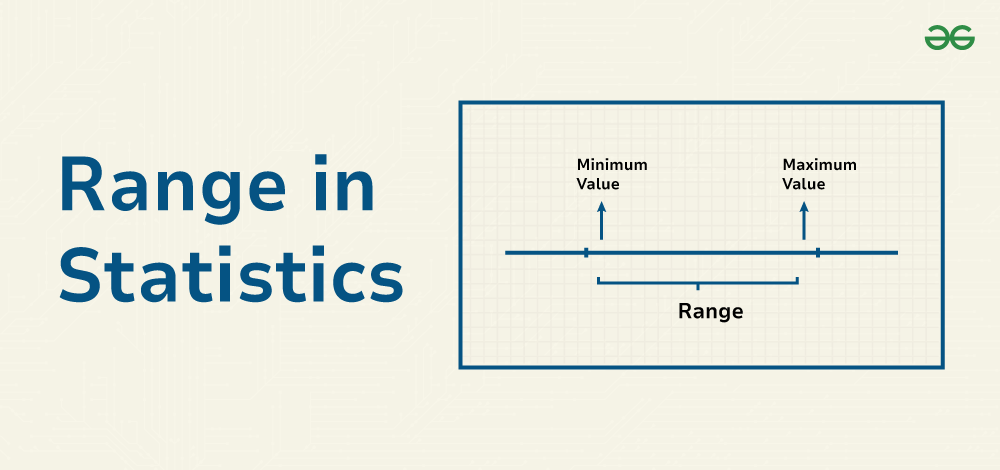
Range in statistics is the difference between the highest and lowest values in a dataset. Range offers a straightforward measurement of the data’s spread or variability. The range statistic is simple and straightforward to calculate, but it has limitations because it only takes into consideration the maximum and minimum values and ignores the distribution of values across the dataset.
Below is the range formula of statistics.
Range = Maximum Value – Minimum Value
Here’s a step-by-step explanation of how to calculate the range:
- Identify the maximum value (the largest value) in your dataset.
- Identify the minimum value (the smallest value) in your dataset.
- Subtract the minimum value from the maximum value to find the range.
Here Is An Solved Example To Find Range
Example: Consider the following dataset of exam scores for a class tenth:
77, 89, 92, 64, 78, 95, 82
Find the Range of the above data
Solution:
Now To Calculate the range
Here, Select The Largest Score as Maximum Value and Smallest score as Minimum Value:

Maximum value = 95
Minimum value = 64
Range = 95 – 64 = 31
So, the range of the exam scores in this dataset is 31.
Range in Dataset
The range of a dataset is quite simple to understand. It is the difference between the highest (maximum) and lowest (minimum) values in that dataset. Mathematically, the formula for calculating the range is as follows:
Range = Maximum Value – Minimum Value
This simple formula provides a quick way to quantify the spread of data.
Range in Grouped Data
In Grouped data where the datasets are arranged in Class Intervals, the Range is find by subtracting the lower limit of the first class interval and the upper limit of the last class interval. We can understand it from the example mentioned below:
|
Class Interval
|
Frequency
|
|
0-10
|
12
|
|
10-20
|
10
|
|
20-30
|
15
|
|
30-40
|
13
|
|
40-50
|
11
|
Range = Upper Limit of the Last Class Interval – Lower Limit of First Class Interval = 50-0 = 50
Range Applications
The applications of range are mentioned below:
- Range has got its application in various fields, such as mathematics, science, economics, and social sciences.
- Range is basically used to analyze the variation and dispersion of a dataset.
- Range is used in educational assessments to understand the variation in scores of Students
- In clinical trials and medical research, the range of outcomes for a particular treatment or medication is studied to determine its effectiveness and potential side effects.
- In sports, range can be applied to analyze player’s performance.
Also Check
Solved Examples on Range
Example 1: You are given a dataset of the ages of students in a classroom:
18, 19, 20, 21, 22, 35, 18, 23
Solution:
Maximum Value = 35
Minimum Value = 18
Range = 35 – 18 = 17
The range of ages among the students is 17 years.
Example 2: Consider a dataset of exam scores for a class:
Scores: 85, 92, 78, 96, 64, 89, 75, find the range?
Solution:
Maximum Value = 96
Minimum Value = 64
Range = 96 – 64 = 32
So, the range of the exam scores is 32.
Example 3: Imagine a dataset of monthly rainfall (in millimeters) for a city for the past year:
Rainfall: 50, 48, 52, 58, 45, 70, 65, 80, 40, 42, 75, 90, find the range of monthly rainfall for the city?
Solution:
Maximum Value = 90
Minimum Value = 40
Range = 90 – 40 = 50
The range of monthly rainfall for the city is 50 mm
Practice Questions On Range In Statistics
Q1. Calculate the range for the following dataset: 12, 15, 20, 25, 30, 35, 40, 45?
Q2. A dataset of temperatures in degrees Celsius for a week is given as follows: 18, 22, 20, 25, 19, 28, 17. Find the range?
Q3. You have a dataset of the heights (in inches) of a group of individuals: 62, 67, 71, 68, 70, 75, 61, 66, 69, 70. Determine the range of heights?
Range in Statistics – FAQs
1. Define Range in Statistics.
The range in statistics refers to the difference between the maximum and minimum values in a dataset. A larger range suggests greater variability, while a smaller range indicates less variation.
2. How do you find Range in Statistics?
To find range of any dataset, we can use the following steps:
Step 1: Sort the data points in ascending or descending order.
Step 2: Find the difference between the first and last value.
Step 3: The range is the absolute value of the difference obtained in step 2.
3. What does the Range tell us about data?
The range provides insight into how much the data values vary from the lowest to the highest. It gives a basic sense of the spread of data points but does not provide information about the distribution or central tendency of the data.
4. When is the Range Useful?
The range is useful when you need a quick and simple measure to understand the spread of data. It’s often used in introductory statistics or when you want a basic overview of data variability.
5. What are Some Alternatives to the Range for Measuring Data Spread?
Alternatives to the range include measures like the interquartile range (IQR), standard deviation, and variance. These measures provide more comprehensive information about data spread and are less sensitive to outliers.
6. Can Range be Negative?
No, the range of the dataset can never be negative, as it is the difference between the maximum value and the minimum value. Therefore, the range can be either zero (when maximum and minimum values are same) or positive only.
7. How can I Interpret the Range?
Interpretation of the range depends on the specific dataset and context. A larger range indicates greater variability in the data, while a smaller range suggests less variability.
8. How to Find the Range?
Range is calculated by finding the difference between the upper most and lower most value of dataset.
Share your thoughts in the comments
Please Login to comment...