Pygal Box Plot
Last Updated :
16 Aug, 2023
Pygal library in Python is an open-source library used for data visualization. We can draw various interactive plots and charts using different datasets. For example, bar charts, line charts, pie charts, radar charts, etc
Install Pygal in Python
Pygal library in Python is an open-source library used for data visualization. We can draw various interactive plots and charts using different datasets. For example, bar charts, line charts, pie charts, box plots, etc. To install the Pygal library in Python execute the below command in the terminal.
pip install pygal
What is Box Plot in Pygal?
A box plot is also known as a Box-and-whisker plot. It is used to represent the numerical data in statistical form through their quartile information. It also represents the outliers present in data for a better understanding. It represents the statistical data as follows:
- Minimum
- First quartile (Q1)
- Median
- Third quartile (Q3)
- Maximum.
Create Box Plot in Pygal
In the below code, we will draw a basic box plot of sample data using the Pygal library. Firstly, import the Pygal library. Create a sample data stored in ‘Team_A_scores’ and ‘Team_B_scores’ and then create a box plot object using pygal.box() method. Adding data to the box plot using add() method. Finally, save the output of the box plot to file ‘box_plot2.svg’. By hovering over any box we can see the stats as seen in the output.
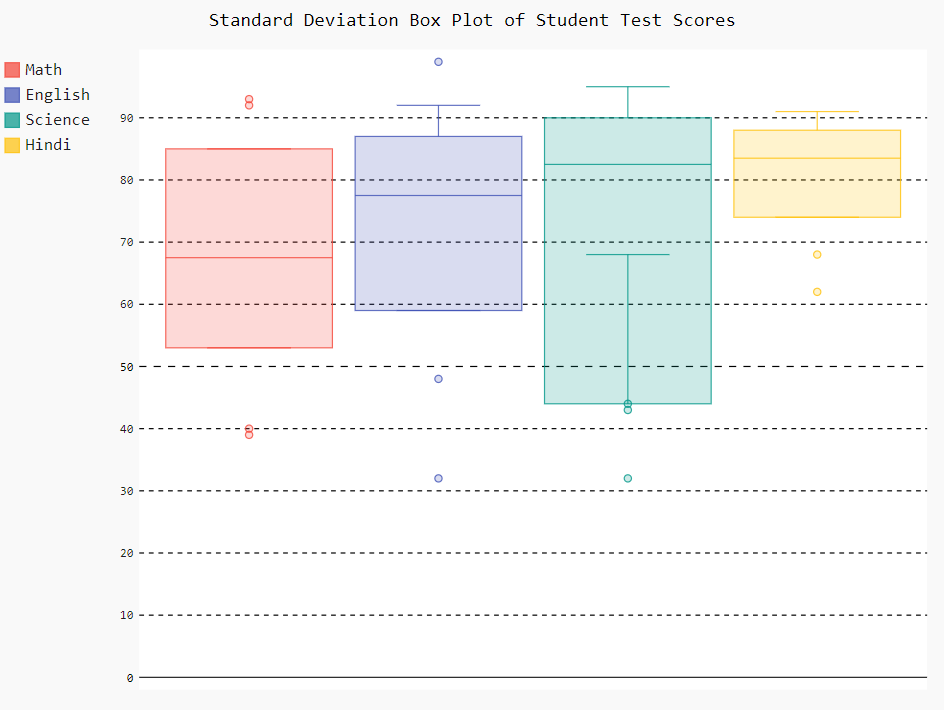
Create Box Plot with Standard Deviation using Pygal in Python
In the below code, we will draw the box plot of student test scores data with standard deviation in the box plot. The procedure to draw a box plot is the same as in the above example the only change is that while creating the box plot object we passed the box_mode=”stdev” as an argument in pygal.Box() method which indicates that the box plot should be created using the standard deviation for the whisker length calculation.
Python3
import pygal
math_scores = [40, 85, 68, 92, 78, 55, 39, 93, 67, 53]
english_scores = [75, 32, 48, 70, 85, 92, 99, 87, 59, 80]
science_scores = [88, 90, 32, 95, 78, 44, 91, 87, 68, 43]
hindi_scores = [88, 90, 62, 84, 78, 74, 91, 87, 68, 83]
box_plot = pygal.Box(box_mode="stdev")
box_plot.title = 'Standard Deviation Box Plot of Student Test Scores'
box_plot.add('Math', math_scores)
box_plot.add('English', english_scores)
box_plot.add('Science', science_scores)
box_plot.add('Hindi', hindi_scores)
box_plot.render_to_file('Box_Plot.svg')
|
Output:
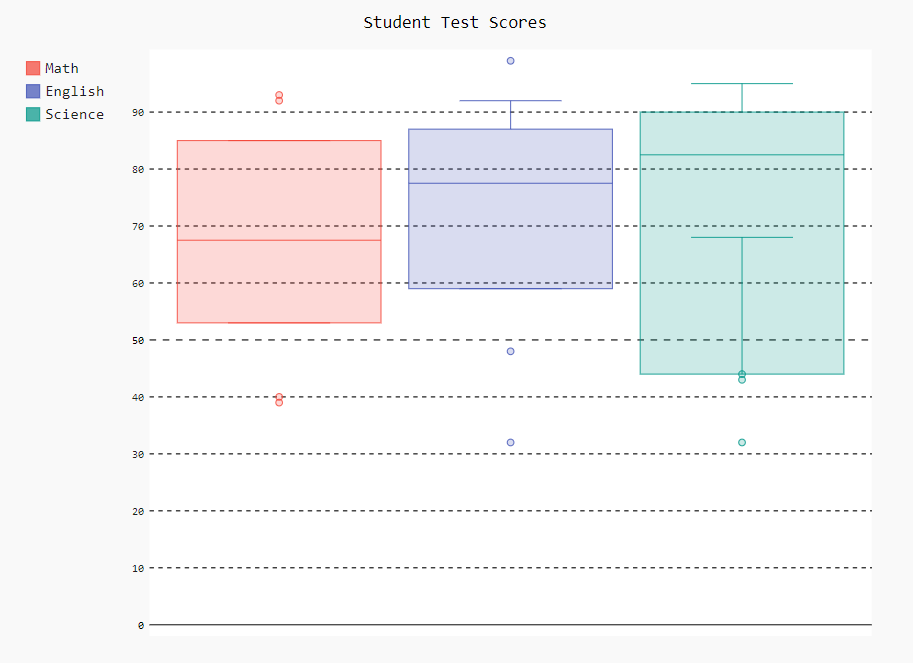
Create Box Plot with Populated Standard Deviation using Pygal in Python
In the below code, we will draw the box plot of student test scores data with populated standard deviation in the box plot. We passed the box_mode=”pstdev” as an argument in pygal.Box() method which sets the box plot mode to display the population standard deviation.
Python3
import pygal
math_scores = [40, 85, 68, 92, 78, 55, 39, 93, 67, 53]
english_scores = [75, 32, 48, 70, 85, 92, 99, 87, 59, 80]
science_scores = [88, 90, 32, 95, 78, 44, 91, 87, 68, 43]
box_plot = pygal.Box(box_mode="pstdev")
box_plot.title = 'Student Test Scores'
box_plot.add('Math', math_scores)
box_plot.add('English', english_scores)
box_plot.add('Science', science_scores)
box_plot.render_to_file('box_plot.svg')
|
Output:
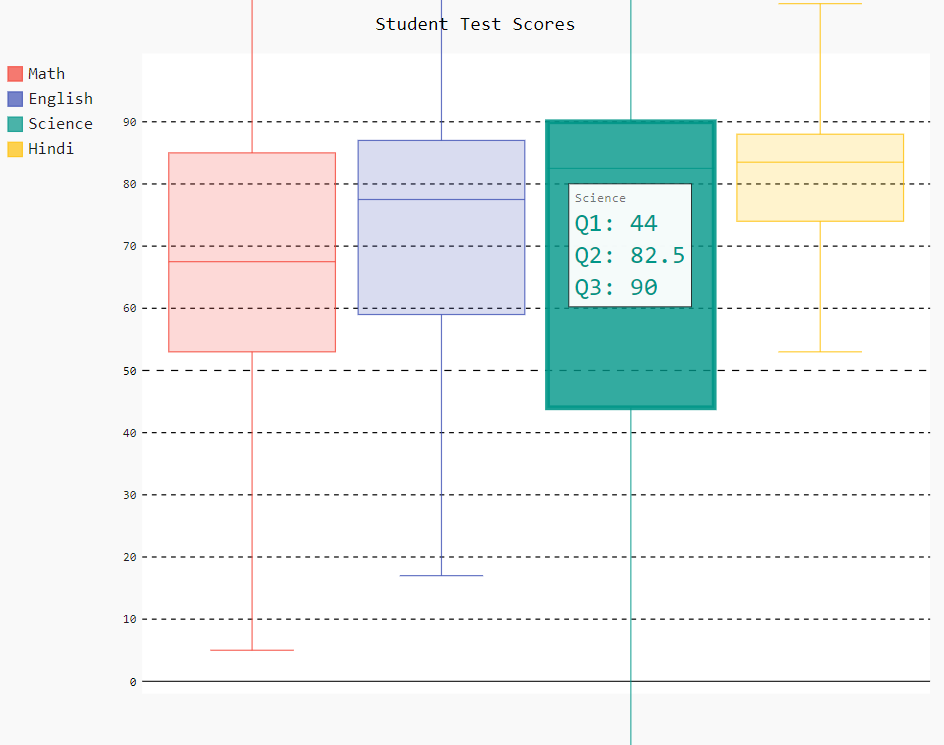
Create Box Plot with Interquartile Range using Pygal in Python
In the below code, we will draw the box plot of student test scores data with an interquartile range. To draw this type of box plot we passed the box_mode=”1.5IQR” as an argument in pygal.Box() method which indicates that the interquartile range (IQR) should be used for determining the whisker length.
Python3
import pygal
math_scores = [40, 85, 68, 92, 78, 55, 39, 93, 67, 53]
english_scores = [75, 32, 48, 70, 85, 92, 99, 87, 59, 80]
science_scores = [88, 90, 32, 95, 78, 44, 91, 87, 68, 43]
hindi_scores = [88, 90, 62, 84, 78, 74, 91, 87, 68, 83]
box_plot = pygal.Box(box_mode="1.5IQR")
box_plot.title = 'Student Test Scores'
box_plot.add('Math', math_scores)
box_plot.add('English', english_scores)
box_plot.add('Science', science_scores)
box_plot.add('Hindi', hindi_scores)
box_plot.render_to_file('box_plot.svg')
|
Output:
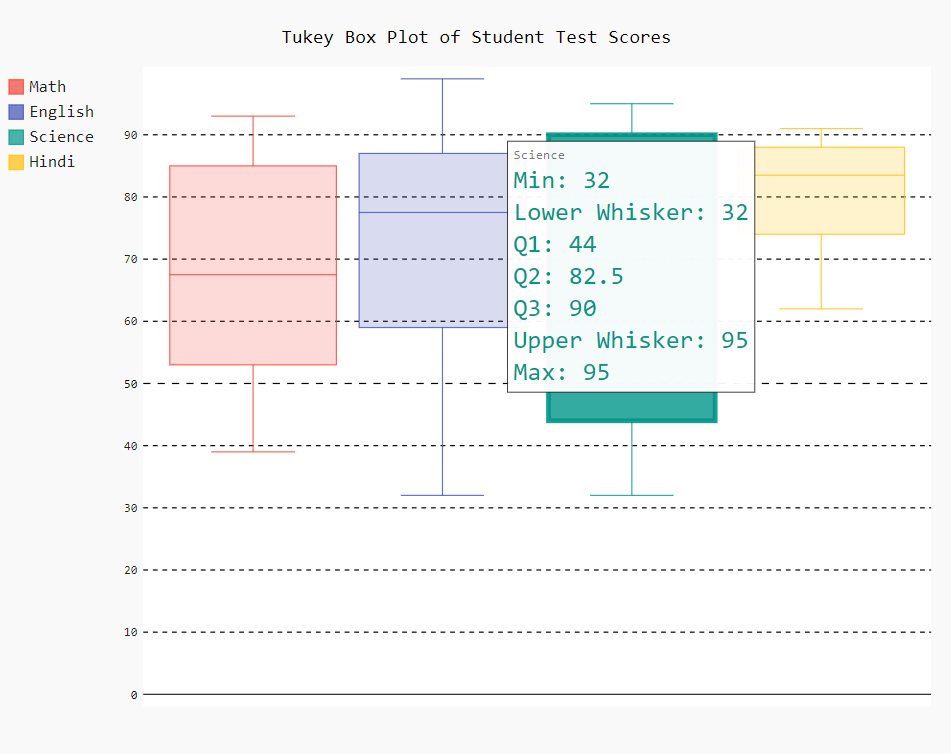
Create Box Plot with Tukey using Pygal in Python
In the below code, we will draw the box plot of student test scores data with Tukey. To draw this type of box plot we passed the box_mode=”tukey” as an argument in pygal.Box() method which indicates that Tukey’s fences (IQR-based limits) should be used for identifying potential outliers.
Python3
import pygal
math_scores = [40, 85, 68, 92, 78, 55, 39, 93, 67, 53]
english_scores = [75, 32, 48, 70, 85, 92, 99, 87, 59, 80]
science_scores = [88, 90, 32, 95, 78, 44, 91, 87, 68, 43]
hindi_scores = [88, 90, 62, 84, 78, 74, 91, 87, 68, 83]
box_plot = pygal.Box(box_mode="tukey")
box_plot.title = ' Tukey Box Plot of Student Test Scores'
box_plot.add('Math', math_scores)
box_plot.add('English', english_scores)
box_plot.add('Science', science_scores)
box_plot.add('Hindi', hindi_scores)
box_plot.render_to_file('Tukey_box_plot.svg')
|
Output:
Share your thoughts in the comments
Please Login to comment...