Half pie chart in Pygal
Last Updated :
28 Jul, 2020
Pygal is a Python module that is mainly used to build SVG (Scalar Vector Graphics) graphs and charts. SVG is a vector-based graphics in the XML format that can be edited in any editor. Pygal can create graphs with minimal lines of code that can be easy to understand.
Half Pie Chart
A half pie chart is also known as half-moon or semi-circle pie chart which is a 180-degree graph that represents the anatomy of a whole pie. The half pie chart works similarly to the regular pie chart. Its main advantage is that it takes less space in the layout and works like a full pie chart does. All the areas are plotted with different colors which helps to understand it more efficiently. It can be created using the Pie() method of pygal module by passing the half_pie attribute. This takes a boolean value.
Syntax:
pie_chart = pygal.Pie(half_pie=True)
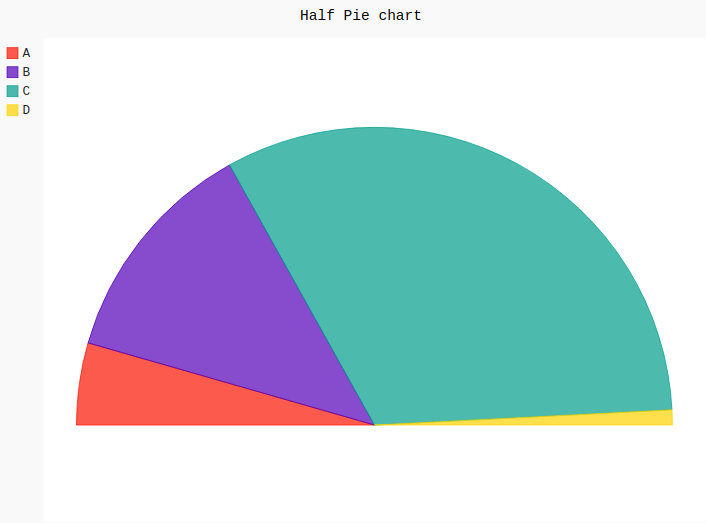
Example 1:
import pygal
pie_chart = pygal.Pie(half_pie = True)
pie_chart.title = 'Half Pie chart'
pie_chart.add('A', 115)
pie_chart.add('B', 322)
pie_chart.add('C', 834)
pie_chart.add('D', 21)
pie_chart
|
Output:
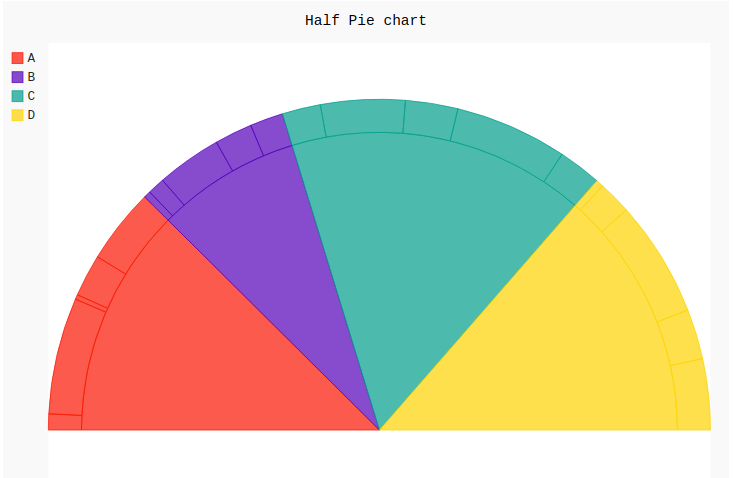
Example 2:
import pygal
import numpy
pie_chart = pygal.Pie(half_pie = True)
pie_chart.title = 'Half Pie chart'
pie_chart.add('A', numpy.random.rand(5))
pie_chart.add('B', numpy.random.rand(5))
pie_chart.add('C', numpy.random.rand(5))
pie_chart.add('D', numpy.random.rand(5))
pie_chart
|
Output:
Share your thoughts in the comments
Please Login to comment...