Permutation Hypothesis Test in R Programming
Last Updated :
24 Nov, 2020
In simple words, the permutation hypothesis test in R is a way of comparing a numerical value of 2 groups. The permutation Hypothesis test is an alternative to:
Let’s implement this test in R programming.
Why use the Permutation Hypothesis Test?
- Small Sample Size.
- Assumptions(for parametric approach) not met.
- Test something other than classic approaches comparing Means and Medians.
- Difficult to estimate the SE for test-statistic.
Permutation Hypothesis Test Steps
- Specify a hypothesis
- Choose test-stat(Eg: Mean, Median, etc. )
- Determine Distribution of test-stat
- Convert test-stat to P-value
Note:
P-value = No. of permutations having a test-stat value greater than observed test-stat value/ No. of permutations.
Implementation in R
- Dataset: Chicken Diet Data. This dataset is a subset of the “chickwts” data in the “R dataset package”. Download the data set here.
- Hypothesis: The weight of the chicken is independent of the type of diet.
Test-Statistics
- Test-Statistics #1: The absolute value of the difference in mean weights for the two diets | Y1 – Y2 |. This is the same test statistics as the independent two-sided two-sample t-test.
- Test-Statistics #2: The absolute value of the difference in median weights for the two diets | Median1 – Median2 |
R
d <- read.table(file = "ChickData.csv",
header = T, sep = ",")
print(d)
names(d)
levels(d$feed)
table(d$feed)
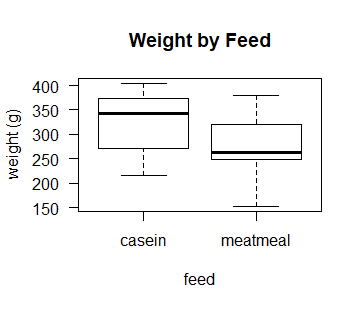
boxplot(d$weight~d$feed, las = 1,
ylab = "weight (g)",
xlab = "feed",
main = "Weight by Feed")
mean(d$weight[d$feed == "casein"])
mean(d$weight[d$feed == "meatmeal"])
test.stat1 <- abs(mean(d$weight[d$feed == "casein"]) -
mean(d$weight[d$feed == "meatmeal"]))
test.stat1
median(d$weight[d$feed == "casein"])
median(d$weight[d$feed == "meatmeal"])
test.stat2 <- abs(median(d$weight[d$feed == "casein"]) -
median(d$weight[d$feed == "meatmeal"]))
test.stat2
set.seed(1979)
n <- length(d$feed)
P <- 100000
variable <- d$weight
PermSamples <- matrix(0, nrow = n, ncol = P)
for(i in 1:P)
{
PermSamples[, i] <- sample(variable,
size = n,
replace = FALSE)
}
PermSamples[, 1:5]
Perm.test.stat1 <- Perm.test.stat2 <- rep(0, P)
for (i in 1:P)
{
Perm.test.stat1[i] <- abs(mean(PermSamples[d$feed == "casein",i]) -
mean(PermSamples[d$feed == "meatmeal",i]))
Perm.test.stat2[i] <- abs(median(PermSamples[d$feed == "casein",i]) -
median(PermSamples[d$feed == "meatmeal",i]))
}
test.stat1; test.stat2
round(Perm.test.stat1[1:15], 1)
round(Perm.test.stat2[1:15], 1)
(Perm.test.stat1 >= test.stat1)[1:15]
mean((Perm.test.stat1 >= test.stat1)[1:15])
mean(Perm.test.stat1 >= test.stat1)
mean(Perm.test.stat2 >= test.stat2)
|
Output:
> print(d)
    weight  feed
1     325 meatmeal
2     257 meatmeal
3     303 meatmeal
4     315 meatmeal
5     380 meatmeal
6     153 meatmeal
7     263 meatmeal
8     242 meatmeal
9     206 meatmeal
10    344 meatmeal
11    258 meatmeal
12    368   casein
13    390   casein
14    379   casein
15    260   casein
16    404   casein
17    318   casein
18    352   casein
19    359   casein
20    216   casein
21    222   casein
22    283   casein
23    332   casein
> names(d)
[1] "weight" "feed"
> levels(d$feed)
[1] "casein"   "meatmeal"
> table(d$feed)
casein meatmeal
  12       11
> mean(d$weight[d$feed == "casein"]) # mean for casein
[1] 323.5833
> mean(d$weight[d$feed == "meatmeal"]) # mean for meatmeal
[1] 276.9091
> test.stat1
[1] 46.67424
> median(d$weight[d$feed == "casein"]) # median for casein
[1] 342
> median(d$weight[d$feed == "meatmeal"]) # median for meatmeal
[1] 263
> test.stat2
[1] 79
> PermSamples[, 1:5]
      [,1] [,2] [,3] [,4] [,5]
 [1,]  379  283  380  352  206
 [2,]  380  303  258  260  380
 [3,]  257  206  379  380  153
 [4,]  283  242  222  404  359
 [5,]  222  260  325  258  258
 [6,]  315  352  153  379  263
 [7,]  352  263  263  325  325
 [8,]  153  325  315  359  216
 [9,]  368  379  344  242  260
[10,]  344  258  368  368  257
[11,]  359  257  206  257  315
[12,]  206  153  404  222  303
[13,]  404  344  303  390  390
[14,]  325  318  318  303  352
[15,]  242  404  332  263  404
[16,]  390  380  257  206  379
[17,]  260  332  216  315  318
[18,]  303  359  352  344  368
[19,]  263  222  242  283  222
[20,]  332  368  260  332  344
[21,]  318  315  283  318  283
[22,]  216  390  390  153  332
[23,]  258  216  359  216  242
> test.stat1; test.stat2
[1] 46.67424
[1] 79
> round(Perm.test.stat1[1:15], 1)
 [1] 17.1 32.4 17.6 47.1 56.1 28.9 31.0 40.8  6.8 13.8  9.1 46.5 28.9 50.9 32.7
> round(Perm.test.stat2[1:15], 1)
 [1] 61.0 75.0  4.5 59.0 78.0 17.0 62.0 38.5  4.5 16.0 23.0 60.5 63.5 75.0 37.0
> (Perm.test.stat1 >= test.stat1)[1:15]
 [1] FALSE FALSE FALSE  TRUE  TRUE FALSE FALSE FALSE FALSE FALSE FALSE FALSE FALSE  TRUE FALSE
> mean((Perm.test.stat1 >= test.stat1)[1:15])
[1] 0.2
> mean(Perm.test.stat1 >= test.stat1)
[1] 0.09959
> mean(Perm.test.stat2 >= test.stat2)
[1] 0.05407
Share your thoughts in the comments
Please Login to comment...