Outlier detection with Local Outlier Factor (LOF) using R
Last Updated :
01 Nov, 2023
In this article, we will study how Outlier detection with Local Outlier Factor (LOF) using R and what are some steps required for this.
What are Outliers?
Outliers are data points that significantly differ from the majority of the data in a dataset. They are unusual or rare observations that stand apart from the typical pattern or distribution of the data. In R Programming Language Outliers can occur for various reasons, including data entry errors, measurement errors, or genuinely exceptional cases.
Outlier detection with Local Outlier Factor (LOF) using R
Outlier detection is an essential task in data analysis and machine learning, where we aim to identify data points that deviate significantly from the majority of the data. One powerful method for detecting outliers is the Local Outlier Factor (LOF) algorithm. LOF quantifies the local deviation of a data point with respect to its neighbors. In this article, we will explore LOF and its implementation in R with practical examples.
The Local Outlier Factor (LOF) is a density-based outlier detection algorithm that assigns an anomaly score to each data point. The core idea behind LOF is to compare the local density of a data point with that of its neighbors. An outlier is defined as a data point with a significantly lower density compared to its neighbors.
The algorithm works as follows
- Distance Calculation: For each data point, calculate the distance to its k-nearest neighbors. The choice of ‘k’ is a crucial parameter that impacts the sensitivity of the LOF algorithm. A higher ‘k’ makes the algorithm less sensitive to local outliers.
- Local Reachability Density (LRD): The LRD of a data point measures the inverse of the average reachability distance from its neighbors. It quantifies the local density of a point relative to its neighbors.
- LOF Calculation: The LOF of a data point is the ratio of its LRD to the LRD of its neighbors. A high LOF score indicates that a data point is less dense compared to its neighbors, suggesting it might be an outlier.
- Anomaly Detection: Data points with high LOF scores are considered outliers. The threshold for identifying outliers is often determined empirically, depending on the dataset and the problem at hand.
Ploting outliers in scatter plot
R
library(dbscan)
set.seed(42)
data <- data.frame(
x = rnorm(100),
y = rnorm(100)
)
data_matrix <- as.matrix(data)
lof_scores <- lof(data_matrix, minPts = 6)
threshold <- 1.5
outliers <- data[lof_scores > threshold, ]
data$outlier <- ifelse(lof_scores > threshold, "Outlier", "Inlier")
library(ggplot2)
ggplot(data, aes(x, y, color = outlier)) +
geom_point() +
scale_color_manual(values = c("blue", "red")) +
theme_minimal() +
labs(title = "Outlier Detection with LOF")
|
Output:
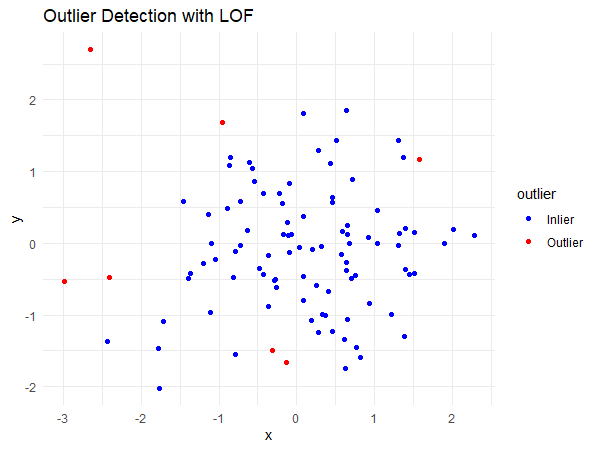
Outlier detection with Local Outlier Factor (LOF) using R
Load Required Packages: You begin by loading the necessary R packages, including dbscan for LOF computation and ggplot2 for data visualization.
- Generate a Synthetic Dataset: In this example, a synthetic dataset with two variables, ‘x’ and ‘y’, containing 100 data points is created using random numbers generated from a normal distribution.
- Convert the Data to a Matrix: The dataset is converted into a matrix format, which is required for LOF calculations.
- Calculate LOF Scores: The LOF scores are calculated using the
lof function from the dbscan package. The minPts parameter is set to 6, which represents the minimum number of neighboring data points considered to determine the local density around a point.
- Define a Threshold: A threshold value is set at 1.5. This threshold is used to classify data points with LOF scores greater than 1.5 as outliers.
- Identify and Mark Outliers: Data points with LOF scores exceeding the defined threshold are identified as outliers. The ‘outliers’ data frame is created to store these outlier points, and a new column ‘outlier’ is added to the original dataset to mark each point as either an “Outlier” or “Inlier” based on the LOF score.
Outlier detection with dbscan
We install the dbscan package for Outlier detection with Local Outlier Factor (LOF) using R.
R
install.packages("dbscan")
library(dbscan)
scaled_data <- scale(data)
lof_result <- lof(scaled_data)
threshold <- 2
outliers <- lof_result > threshold
|
Load your dataset into R. For this example, we’ll assume you have a data frame named data with the features you want to use for outlier detection.
- It’s often a good practice to standardize your data so that all features have the same scale. This step is crucial for LOF as it relies on distances between data points. You can use the
scale function to do this.
- Use the
dbscan package to calculate the LOF values for each data point in your dataset. You can use the lof function for this.
- This will give you a numeric vector of LOF scores, where each score corresponds to a data point in our dataset.
- need to set a threshold to classify data points as outliers or not. The LOF values can be used to decide which points are outliers. A common approach is to consider points with LOF scores significantly higher than 1 as outliers. Adjust this threshold based on your specific dataset and problem.
Visualize the Outliers
Visualize the outliers through Plot function.
R
plot(lof_result, pch = 19, col = ifelse(outliers, "red", "blue"),
main = "LOF Outlier Detection", xlab = "Data Point", ylab = "LOF Score")
legend("topright", legend = c("Outlier", "Inlier"), col = c("red", "blue"),
pch = 19)
|
Output:
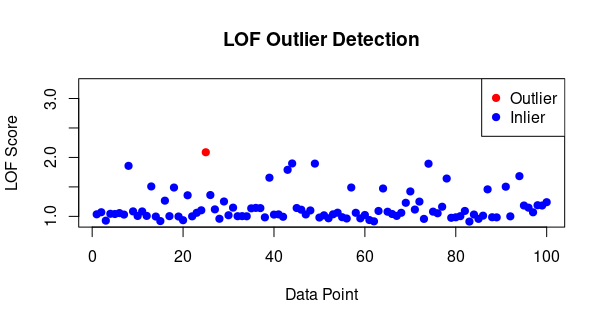
Outlier detection with Local Outlier Factor (LOF) using R
plot is used to create a scatter plot where points are colored based on whether they are classified as outliers or not.- The
legend function adds a legend to the plot to indicate the colors used for outliers and inliers.
Conclusion
The Local Outlier Factor (LOF) algorithm is a powerful tool for detecting outliers in your datasets. By comparing the local density of data points with their neighbors, LOF can reveal data points that deviate significantly from the norm. In this article, we demonstrated how to use LOF for outlier detection in R with a step-by-step example. Proper parameter tuning, such as the choice of ‘k’ and the threshold, is essential to adapt LOF to your specific dataset and problem. LOF can be a valuable addition to your data analysis and anomaly detection toolkit.
Share your thoughts in the comments
Please Login to comment...