Anomaly is a deviation from the expected or normal behavior or pattern. Anomaly detection is the process of identifying these unusual patterns or behaviors in data. It is important because anomalies can indicate important events or problems, such as fraudulent activity, equipment failure, or security breaches.
Anomaly detection is used in a variety of fields, including finance, healthcare, manufacturing, and cybersecurity. It can be used to monitor data in real-time, or to analyze large datasets for patterns and anomalies.
One example of an anomaly in real life is a sudden spike in credit card usage. This could be an indication of fraudulent activity, such as someone using a stolen credit card. In this case, the anomaly detection system would flag the unusual pattern of credit card usage and alert the card issuer, who can then investigate and take appropriate action to prevent the fraud.
Another example of an anomaly is a sudden drop in the performance of a piece of equipment, such as a car engine. This could be an indication of a problem with the equipment, such as a faulty part or a malfunction. In this case, the anomaly detection system could alert the owner of the equipment, who can then take steps to diagnose and fix the problem.
To use anomaly detection, data is first collected and processed. This may involve cleaning and organizing the data, and selecting the appropriate algorithms and techniques for analyzing the data. The anomalies are then identified using statistical methods, machine learning algorithms, or other techniques, and are reported or flagged for further investigation. The specific approach used will depend on the specific application and the nature of the data being analyzed.
What are the concepts needed to understand Anomaly Detection?
To understand anomaly detection, it is helpful to have a basic understanding of some key concepts, including:
Data: Anomaly detection involves analyzing data to identify unusual patterns or behaviors. The data can come from a variety of sources, such as sensors, transactions, or logs.
Normal behavior: In order to identify anomalies, it is necessary to have a baseline or reference for what is considered normal behavior. This can be determined by analyzing historical data or by using domain knowledge to define what is expected.
Anomaly: An anomaly is a deviation from the expected or normal behavior or pattern. It can indicate important events or problems, such as fraudulent activity, equipment failure, or security breaches.
Algorithms and techniques: Anomaly detection uses a variety of algorithms and techniques to analyze data and identify anomalies. These may include statistical methods, machine learning algorithms, or other approaches.
Evaluation and validation: After anomalies are identified, it is important to evaluate and validate the results to ensure that they are accurate and meaningful. This may involve comparing the results to known anomalies, or using domain knowledge to interpret the findings.
Anomaly Detection Algorithms
There are many different algorithms and approaches to anomaly detection, and choosing the right one can be a challenge. In this blog post, we will focus on anomaly detection algorithms in the Scikit Learn library, which is a popular machine learning library for Python.
One of the most widely used algorithms for anomaly detection is the Local Outlier Factor (LOF) algorithm. This algorithm uses the local density of points in a dataset to identify anomalies. The basic idea is that, in most datasets, the density of points is relatively uniform, with only a few points having significantly lower or higher densities than the rest. The LOF algorithm uses this property to identify points that have a significantly lower density than their neighbors, which are likely to be anomalies.
To use the LOF algorithm, we first need to choose a metric to measure the density of points. The most common choice is the k-nearest neighbor (k-NN) distance, which measures the distance of each point to its k-nearest neighbors. The LOF algorithm then calculates the local density of each point using this metric, and identifies points that have a significantly lower density than their neighbors as anomalies.
Another popular algorithm for anomaly detection is the Isolation Forest algorithm. This algorithm uses decision trees to identify anomalies, by isolating points that are difficult to reach in the decision tree. The basic idea is that, in most datasets, the majority of points can be reached in the decision tree with only a few splits. Anomalies, on the other hand, are typically isolated from the rest of the data, requiring many splits to reach them in the decision tree. The Isolation Forest algorithm uses this property to identify anomalies by isolating points that are difficult to reach in the decision tree.
One-class Support Vector Machines (SVMs) are another popular approach to anomaly detection. This algorithm uses support vector machines to learn a decision boundary that separates the majority of the data from the anomalies. The basic idea is that, in most datasets, the majority of points belong to a single cluster, while anomalies form a separate cluster. The One-class SVM algorithm uses this property to learn a decision boundary that separates the majority of the data from the anomalies, and uses this boundary to identify points that are likely to be anomalies.
Finally, the Elliptic Envelope algorithm is another approach to anomaly detection that assumes that the data is normally distributed. This algorithm fits an ellipse around the data, and identifies points that fall outside of the ellipse as anomalies. The basic idea is that, in a normally distributed dataset, most of the points will fall within the ellipse, while anomalies will fall outside of it. The Elliptic Envelope algorithm uses this property to identify anomalies by fitting an ellipse around the data and identifying points that fall outside of it.
There are many different anomaly detection algorithms available in the Scikit Learn library, each with its own strengths and weaknesses. The choice of algorithm will depend on the specific characteristics of the dataset and the desired outcome. It is often useful to try multiple algorithms and compare their performance to determine which one is best suited for the task at hand.
Algorithm Implementation
Here are hands-on examples of using each of the anomaly detection algorithms discussed in the previous answer:
1. Local Outlier Factor (LOF):
Python3
import numpy as np
import matplotlib.pyplot as plt
from sklearn.datasets import load_iris
from sklearn.neighbors import LocalOutlierFactor
df = load_iris(as_frame=True).frame
X = df[['sepal length (cm)','sepal width (cm)']]
lof = LocalOutlierFactor(n_neighbors=5)
lof.fit(X)
scores = lof.negative_outlier_factor_
outliers = np.argwhere(scores > np.percentile(scores, 95))
colors=['green','red']
for i in range(len(X)):
if i not in outliers:
plt.scatter(X.iloc[i,0], X.iloc[i,1], color=colors[0])
else:
plt.scatter(X.iloc[i,0], X.iloc[i,1], color=colors[1])
plt.xlabel('sepal length (cm)',fontsize=13)
plt.ylabel('sepal width (cm)',fontsize=13)
plt.title('Anomly by Local Outlier Factor',fontsize=16)
plt.show()
|
Outputs :
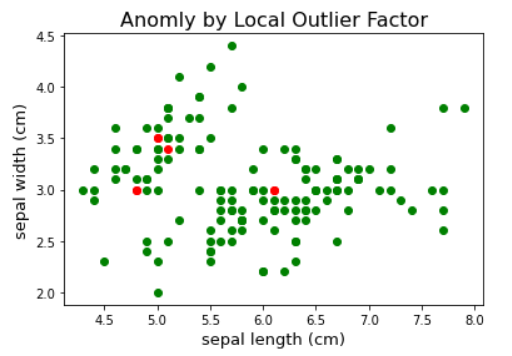
Anomly by Local Outlier Factor
2. Isolation Forest:
Python3
import numpy as np
import matplotlib.pyplot as plt
from sklearn.datasets import load_iris
from sklearn.ensemble import IsolationForest
df = load_iris(as_frame=True).frame
X = df[['sepal length (cm)','sepal width (cm)']]
model = IsolationForest(contamination=0.05)
model.fit(X)
scores = model.decision_function(X)
outliers = np.argwhere(scores < np.percentile(scores, 5))
colors=['green','red']
for i in range(len(X)):
if i not in outliers:
plt.scatter(X.iloc[i,0], X.iloc[i,1], color=colors[0])
else:
plt.scatter(X.iloc[i,0], X.iloc[i,1], color=colors[1])
plt.xlabel('sepal length (cm)',fontsize=13)
plt.ylabel('sepal width (cm)',fontsize=13)
plt.title('Anomly by Isolation Forest',fontsize=16)
plt.show()
|
Outputs :

Anomly by Isolation Forest
3. One-class Support Vector Machines (SVMs):
Python3
import numpy as np
import matplotlib.pyplot as plt
from sklearn.datasets import load_iris
from sklearn import svm
df = load_iris(as_frame=True).frame
X = df[['sepal length (cm)','sepal width (cm)']]
model = svm.OneClassSVM(nu=0.05)
model.fit(X)
scores = model.decision_function(X)
outliers = np.argwhere(scores < np.percentile(scores, 5))
colors=['green','red']
for i in range(len(X)):
if i not in outliers:
plt.scatter(X.iloc[i,0], X.iloc[i,1], color=colors[0])
else:
plt.scatter(X.iloc[i,0], X.iloc[i,1], color=colors[1])
plt.xlabel('sepal length (cm)',fontsize=13)
plt.ylabel('sepal width (cm)',fontsize=13)
plt.title('Anomly by One-class Support Vector Machines',fontsize=16)
plt.show()
|
Outputs :
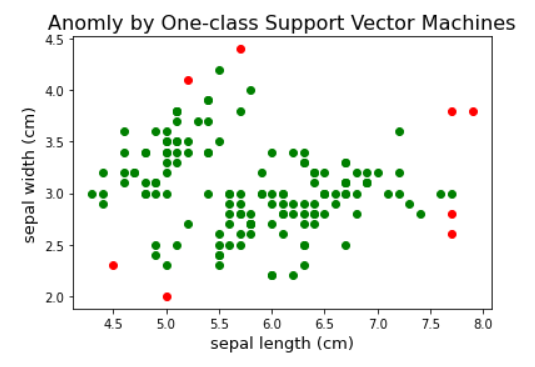
Anomly by One-class Support Vector Machines
4. Elliptic Envelope:
Python3
import numpy as np
import matplotlib.pyplot as plt
from sklearn.datasets import load_iris
from sklearn.covariance import EllipticEnvelope
df = load_iris(as_frame=True).frame
X = df[['sepal length (cm)','sepal width (cm)']]
model = EllipticEnvelope(contamination=0.05)
model.fit(X)
scores = model.decision_function(X)
outliers = np.argwhere(scores < np.percentile(scores, 5))
colors=['green','red']
for i in range(len(X)):
if i not in outliers:
plt.scatter(X.iloc[i,0], X.iloc[i,1], color=colors[0])
else:
plt.scatter(X.iloc[i,0], X.iloc[i,1], color=colors[1])
plt.xlabel('sepal length (cm)',fontsize=13)
plt.ylabel('sepal width (cm)',fontsize=13)
plt.title('Anomly by Elliptic Envelope',fontsize=16)
plt.show()
|
Outputs :

Anomly by Elliptic Envelope
In all of the above examples, X is the input dataset and outliers is an array of indices that correspond to the points in X that were identified as outliers. Note that the exact values of the parameters and thresholds used in these examples may need to be adjusted depending on the specific characteristics of the dataset.
Conclusion
In conclusion, anomaly detection is a crucial tool for identifying unusual patterns or behaviors in data. It is used in a wide range of applications, including finance, healthcare, manufacturing, and cybersecurity. By using appropriate algorithms and techniques, anomalies can be detected and flagged for further investigation, helping organizations to prevent problems and take timely action. Anomaly detection is an essential part of data analysis, and continues to evolve and improve as new technologies and methods are developed.
Share your thoughts in the comments
Please Login to comment...