Matplotlib.pyplot.loglog() function in Python
Last Updated :
06 Jul, 2021
Prerequisites: Matplotlib
Matplotlib is a comprehensive library for creating interactive, static and animated visualizations in python. Using general-purpose GUI toolkits like wxPython, SciPy, Tkinter or SciPy, it provides an object-oriented API for embedding plots into applications. Matplotlib.pyplot is a collection of functions that makes Matplotlib work like MATLAB.
Here, we will be exploring loglog() function of Matplotlib.pyplot. It is used to plot a log scale over both x and y-axis.
Syntax:
loglog(X,Y)
Where,
X and Y refer to x and y coordinates respectively.
Other function used is linespace(). It returns evenly spaced numbers over a specified interval.
Syntax:
np.linspace(start, stop, num, endpoint, retstep, dtype, axis)
Where,
- Start : The starting value of sequence from where you want to show the line, or we can say starting point of line
- Stop : It is the end value of the sequence at where the line stops, unless ‘endpoint’ is set to False.
- Num : Number of samples to generate. Must be non-negative. By default, it is 50.
- Endpoint : It works same as stop. If it is True then stop is the last sample else stop is excluded from the sequence.
- Retstep : If True, return (‘samples’, ‘step’), where `step` is the spacing between samples.
- Dtype : The type of the output array.
- Axis : The axis in the result to store the samples and it is relevant only if start or stop are array-like
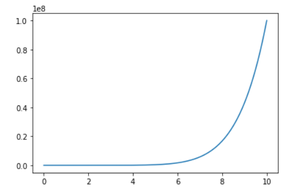
Example : Without loglog()
Python
import matplotlib.pyplot as plt
import numpy as np
x_input = np.linspace(0, 10, 50000)
y_input = x_input**8
plt.plot(x_input, y_input)
|
Output:
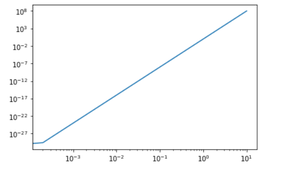
Example : With loglog()
Python3
import matplotlib.pyplot as plt
import numpy as np
x_input = np.linspace(0, 10, 50000)
y_input = x_input**8
plt.loglog(x_input, y_input)
|
Output:
Share your thoughts in the comments
Please Login to comment...