Matplotlib.pyplot.suptitle() function in Python
Last Updated :
28 Jul, 2020
Matplotlib is a library in Python and it is a mathematical extension for NumPy library. Pyplot is a state-based interface to a Matplotlib module which provides a MATLAB-like interface.
matplotlib.pyplot.suptitle() Function
The suptitle() function in pyplot module of the matplotlib library is used to add a title to the figure.
Syntax: matplotlib.pyplot.suptitle(t, **kwargs)
Parameters: This function will have following parameters:
- t : The title text you want to add to your graph.
- x : The x location of the text in figure coordinates. It’s default value is 0.5.
- y : The y location of the text in figure coordinates. It’s default value is 0.98.
- horizontalalignment (ha) : {‘center’, ‘left’, right’}, The horizontal alignment of the text is relative to (x, y). It’s default value is ‘center’.
- verticalalignment (va) : {‘top’, ‘center’, ‘bottom’, ‘baseline’}, The vertical alignment of the text is relative to (x, y). It’s default value is ‘top’.
- fontsize, size : {size in points, ‘xx-small’, ‘x-small’, ‘small’, ‘medium’, ‘large’, ‘x-large’, ‘xx-large’}, The font size of the text. It’s default value is ‘large’.
- fontweight, weight : {a numeric value in range 0-1000, ‘ultralight’, ‘light’, ‘normal’, ‘regular’, ‘book’, ‘medium’, ‘roman’, ‘semibold’, ‘demibold’, ‘demi’, ‘bold’, ‘heavy’, ‘extra bold’, ‘black’}, The font weight of the text. It’s default value is ‘normal’.
- fontproperties : None or dict, A dict of font properties. If fontproperties is given the default values for font size and weight are taken from the FontProperties defaults. rcParams[“figure.titlesize”] = ‘large’ and rcParams[“figure.titleweight”] = ‘normal’ are ignored in this case.
- **kwargs : Additional kwargs are matplotlib.text.Text properties.
Returns: The Text instance of the title.
Below examples illustrate the matplotlib.pyplot.suptitle() function in matplotlib.pyplot:
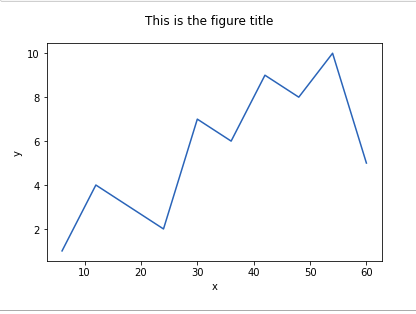
Example 1: Adding a title to the graph with font size 12.
Python3
import matplotlib.pyplot as plt
x = [6, 12, 18,
24, 30, 36,
42, 48, 54,
60]
y = [1, 4, 3,
2, 7, 6,
9, 8, 10,
5]
plt.plot(x, y)
plt.xlabel('x')
plt.ylabel('y')
plt.suptitle('This is the figure title',
fontsize = 12)
plt.show()
|
Output :
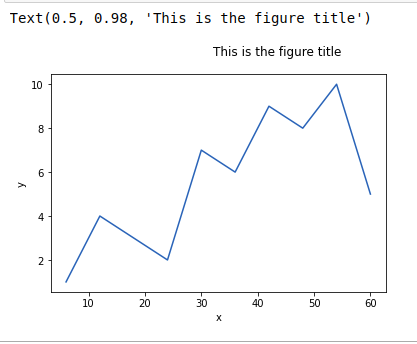
Example 2: Adding title to the graph with left horizontal alignment and font size 12.
Python3
import matplotlib.pyplot as plt
x = [6, 12, 18,
24, 30, 36,
42, 48, 54,
60]
y = [1, 4, 3,
2, 7, 6,
9, 8, 10,
5]
plt.plot(x, y)
plt.xlabel('x')
plt.ylabel('y')
plt.suptitle('This is the figure title',
ha = 'left',
fontsize = 12)
|
Output:
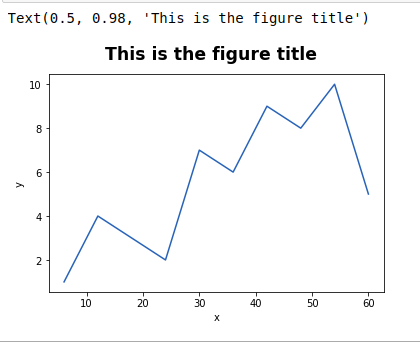
Example 3: Adding title to the graph with extra bold font weight and large font size.
Python3
import matplotlib.pyplot as plt
x = [6, 12, 18,
24, 30, 36,
42, 48, 54,
60]
y = [1, 4, 3,
2, 7, 6,
9, 8, 10,
5]
plt.plot(x, y)
plt.xlabel('x')
plt.ylabel('y')
plt.suptitle('This is the figure title',
fontsize = 'xx-large',
weight = 'extra bold')
|
Output:
Like Article
Suggest improvement
Share your thoughts in the comments
Please Login to comment...