Matplotlib.axes.Axes.add_artist() in Python
Last Updated :
21 Apr, 2020
Matplotlib is a library in Python and it is numerical – mathematical extension for NumPy library. The Axes Class contains most of the figure elements: Axis, Tick, Line2D, Text, Polygon, etc., and sets the coordinate system. And the instances of Axes supports callbacks through a callbacks attribute.
matplotlib.axes.Axes.add_artist() Function
The Axes.add_artist() function in axes module of matplotlib library is used to add an Artist to the axes, and return the artist.
Syntax: Axes.add_artist(self, a)
Parameters: This method accepts the following parameters.
- a: This parameter is the legend which is produced by legend() function .
Return value: This method returns the artist.
Below examples illustrate the matplotlib.axes.Axes.add_artist() function in matplotlib.axes:
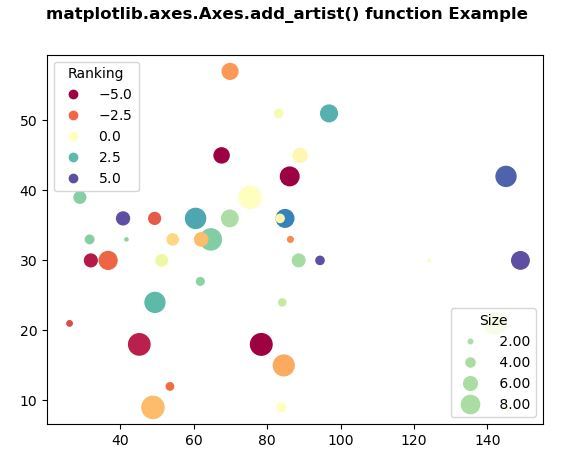
Example 1:
import numpy as np
np.random.seed(19680801)
import matplotlib.pyplot as plt
volume = np.random.rayleigh(27, size = 40)
amount = np.random.poisson(10, size = 40)
ranking = np.random.normal(size = 40)
price = np.random.uniform(1, 10, size = 40)
fig, ax = plt.subplots()
scatter = ax.scatter(volume * 2, amount * 3,
c = ranking * 3,
s = 0.3*(price * 3)**2,
vmin =-4, vmax = 4,
cmap ="Spectral")
legend1 = ax.legend(*scatter.legend_elements(num = 5),
loc ="upper left",
title ="Ranking")
ax.add_artist(legend1)
kw = dict(prop ="sizes", num = 5,
color = scatter.cmap(0.7),
fmt =" {x:.2f}",
func = lambda s: np.sqrt(s/.3)/3)
legend2 = ax.legend(*scatter.legend_elements(**kw),
loc ="lower right",
title ="Size")
fig.suptitle('matplotlib.axes.Axes.add_artist() \
function Example\n\n', fontweight ="bold")
plt.show()
|
Output:
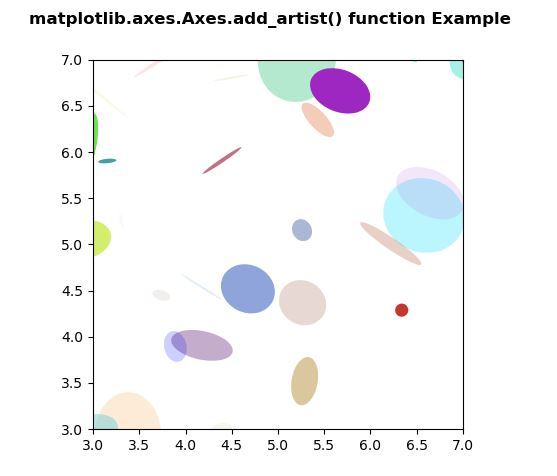
Example 2:
import matplotlib.pyplot as plt
import numpy as np
from matplotlib.patches import Ellipse
NUM = 200
ells = [Ellipse(xy = np.random.rand(2) * 10,
width = np.random.rand(),
height = np.random.rand(),
angle = np.random.rand() * 360)
for i in range(NUM)]
fig, ax = plt.subplots(subplot_kw ={'aspect': 'equal'})
for e in ells:
ax.add_artist(e)
e.set_clip_box(ax.bbox)
e.set_alpha(np.random.rand())
e.set_facecolor(np.random.rand(4))
ax.set_xlim(3, 7)
ax.set_ylim(3, 7)
fig.suptitle('matplotlib.axes.Axes.add_artist() \
function Example\n\n', fontweight ="bold")
plt.show()
|
Output:
Share your thoughts in the comments
Please Login to comment...