Implementation of KNN using OpenCV
Last Updated :
04 Jan, 2023
KNN is one of the most widely used classification algorithms that is used in machine learning. To know more about the KNN algorithm read here KNN algorithm
Today we are going to see how we can implement this algorithm in OpenCV and how we can visualize the results in 2D plane showing different features of classes we have in our training data.
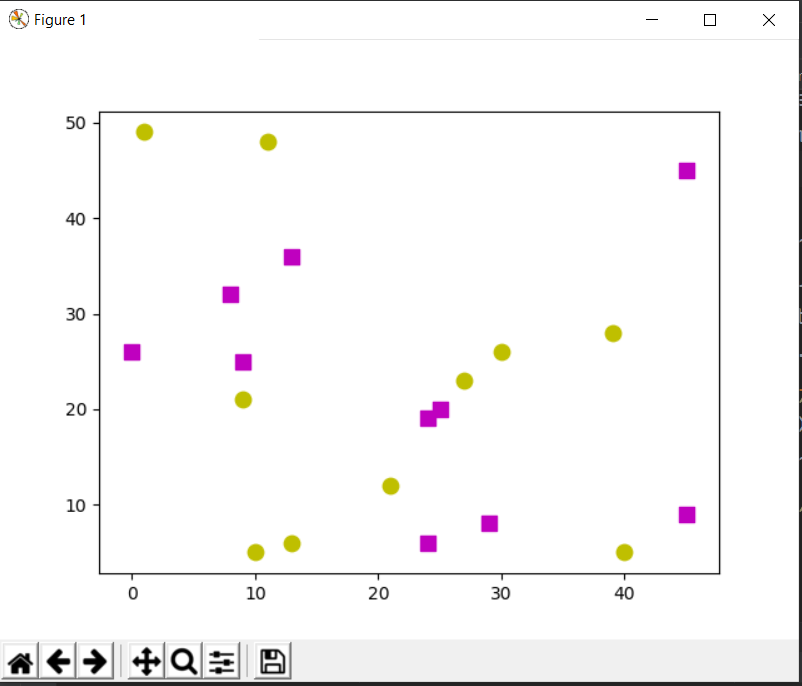
Let’s consider two classes for our code. We generate 20 random data points belonging to the 2 classes using a random generator. The training points will be either of the ‘magenta’ class or ‘yellow’ class. The magenta is drawn as square and the label for magenta is 1 similarly yellow is drawn as a circle and is labelled as 0.
Code:
Python3
import cv2 as cv
import numpy as np
import matplotlib.pyplot as plt
Data_points = np.random.randint(0, 50, (20, 2)).astype(np.float32)
labels = np.random.randint(0, 2, (20, 1)).astype(np.float32)
yellow = Data_points[labels.ravel()== 0]
magenta = Data_points[labels.ravel()== 1]
plt.scatter(yellow[:, 0], yellow[:, 1], 80, 'y', 'o')
plt.scatter(magenta[:, 0], magenta[:, 1], 80, 'm', 's')
plt.show()
|
Output:
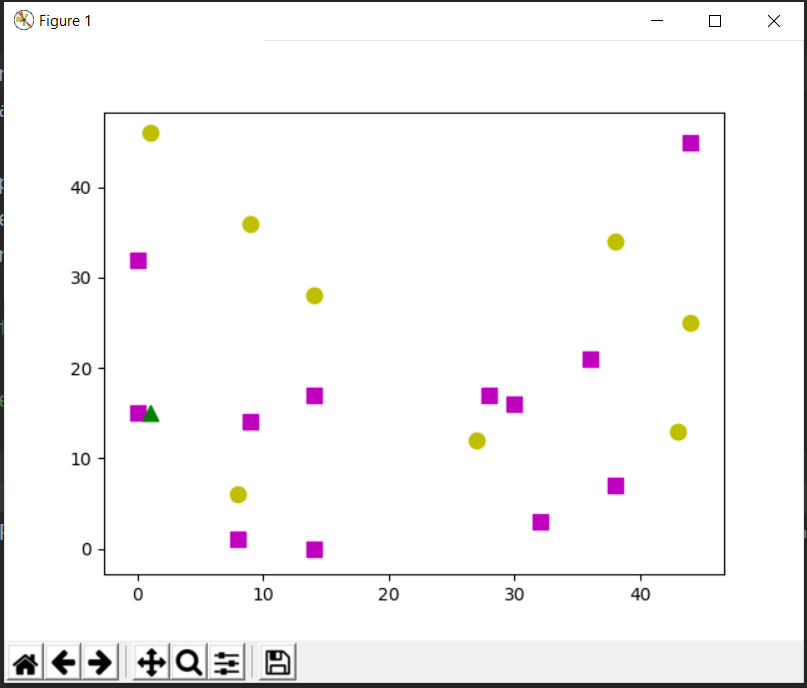
Now consider an unknown new data point, our KNN classifier will label that data point either 0 or 1 depending on its features and the number of neighbours that are defined by us.
Code:
Python3
unknown = np.random.randint(0, 50, (1, 2)).astype(np.float32)
knn = cv.ml.KNearest_create()
knn.train(Data_points, cv.ml.ROW_SAMPLE, labels)
ret, res, neighbours, distance = knn.findNearest(unknown, 5)
plt.scatter(unknown[:, 0], unknown[:, 1], 80, 'g', '^')
plt.show()
print( "Label of the unknown data - ", res )
print( "Nearest neighbors - ", neighbours )
print( "Distance of each neighbor - ", distance )
|
Output:
Label of the unknown data -  [[1.]]
Nearest neighbors -   [[1. 1. 0. 1. 1.]]
Distance of each neighbor -  [[  1.  65. 130. 173. 245.]]
Share your thoughts in the comments
Please Login to comment...