HTTP Statistics in Wireshark
Last Updated :
26 Oct, 2022
Cybersecurity become an important component of every sector since organizations started shifting from physical stores to digital markets. Online platforms provide endless capabilities like global markets, better income, more customers etc. Along with This comes the problems of online platforms like maintaining stability of network, providing secure authorization, safeguarding customer’s data etc. To cope with such situations, Wireshark was launched for resolving network issues by analyzing them at micro level. It is really helpful tool for all the network issues and on the top, it is free to use.
HTTP stands for Hypertext Transfer Protocol, which is a web protocol that utilizes port 80. It is mainly used for requesting and serving contents of websites and web applications. It works on the application layer of OSI model. All the World Wide Web information is communicated with the help of HTTP protocol. Nowadays, HTTP has been upgraded to HTTPS, which is more secure due to encryption of data.
HTTP Statistics in Wireshark:
It is a window in Wireshark which is used to display the details of captured HTTP packets. HTTP packets are used to analyze the web content transferred over the network. It contains login credentials in plain text, that’s why websites now uses HTTPS which transmits the data in encrypted form. By analysis of web content one can get the receiver’s IP address, website name and other useful information which can be used for phishing attacks, credential stuffing, data exfiltration etc.
This window can be found under statistics tab, see the below image
HTTP Statistics contains 4 different analysis windows which are :
- Packet Counter: It is used for analyzing the information of HTTP requests and their returned response codes.
- Requests: It indicates the data related to the host which made the HTTP request along with URI (Universal Resource Identifier).
- Load Distribution: It is used to provide the information about server like how different data packets are travelling from switch to switch for distributing load and maintaining stability.
- Request Sequences: This windows put the HTTP requests in a tree structure on the basis of location headers and referrers, to give an idea of how a single HTTP request further makes another request and so on.
Clicking on any of the above option will open a new window which contains the following information:
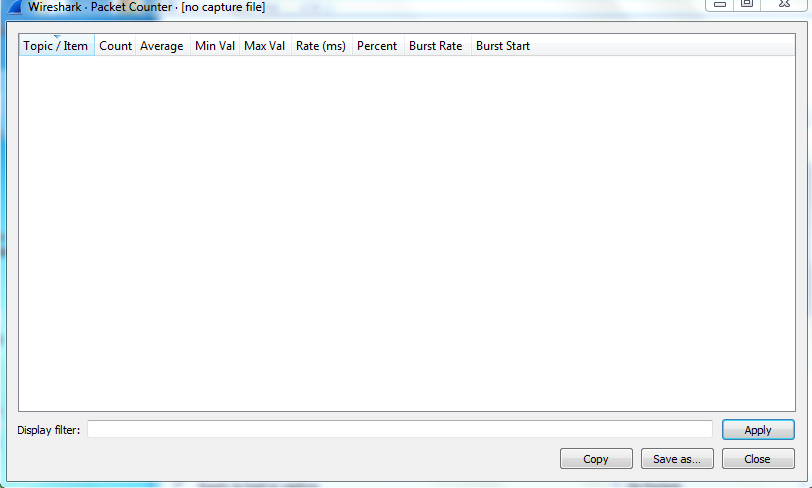
- Topic/Item : This field can be sorted on the basis of packet counter, type of request, request sequences etc. and provides information about address message like IAM (Initial Address Message), SAM (Subsequent address message), ACM (Address Complete Message) etc.
- Count : It shows the count of different HTTP requests and responses.
- Average: It shows the average value for a data packet for transmitting HTTP requests and receiving responses.
- Min Val: It shows the minimum value required by any HTTP request or response packet for data transfer.
- Max Val: It shows the maximum value required by any HTTP request or response packet for data transfer.
- Rate: It is used to show the transfer rate of bits, which is used in checking the stability of the signal.
- Percent: It shows the percentage of data of each HTTP packet.
- Burst Rate: It is the maximum capacity of transmitting data in a specified time span.
- Burst Start: Bust start is the time point when burst starts.
Let’s understand with the captured data:
In the image, it can be seen that 4 HTTPS packets are sent and all the information about them is clearly visible.
Conclusion:
It is clear from the captured data that there are websites which still use the HTTPS protocol which is insecure, so organizations should switch to HTTPS for safe data transfer which is encrypted to avoid any data leaks.
Share your thoughts in the comments
Please Login to comment...