How to use Jinja for Data Visualization
Last Updated :
06 Dec, 2023
Jinja is a powerful templating engine for rendering text whether it be HTML, LaTeX, or just anything that is just pure text. This article provides an introduction to how to utilize Jinja for Data Visualization. First, it presents the idea and finally provides an example of rendering a simple bar graph on a web page using a Jinja template rendered into HTML with the help of Python programming language. This article assumes basic familiarity with Jinja and Python.
Jinja for Data Visualization
This section discusses the basic idea of how to visualize data with Jinja. We know that Jinja generates text using a template and data is passed to that template. So we can design Jinja templates to process data and output some text files like HTML or LaTeX or any other text that can be rendered by some software such that it visualizes that data. Here is the description in step-by-step form –
Steps to visualize data with Jinja
Step 1: Decide what software can visualize your data (like a browser, LaTeX engine, etc.) which renders using text.
Step 2: Write a Jinja Template that can process the given data into a text-file/text that can be rendered using your chosen software to visualize the data. Like HTML file for browser.
Step 3: Using a Python program, load the data and then render the Jinja Template with the data to get an output text file.
Step 4: Render the output file on the chosen software to see the visualization of your data. (For example, if it’s an HTML file, render it using browser to see output).
Rendering a web page with Bar Graph using Jinja
In this section, we visualize bar chart for comparing the popularity of different programming languages (Disclaimer: The data used is just some random data and does not represent any real thing in particular). We keep our data in a CSV file. We create a Jinja template to render an HTML file (which uses Chart.js library to visualize the bar chart). The csv file is read using pandas and the template is rendered and served on localhost using Flask. One doesn’t need to be much familiar with any of these except Python and Jinja to work out this example.
Installation
After installing Python, we need to install Flask, jinja2 and pandas modules. We can use the following commands to install them –
On Windows -
py -m pip install flask, jinja2, pandas
On Linux -
python3 -m pip install flask, jinja2, pandas
Project Structure
We need to create the following file-folder structure to setup the project –
demoVisualization
|_ templates
|    |_ visualizationTemplate.html
|_ data.csv
|_ renderer.py
This is mainly required for working with flask.
Explanation and content of the files
The data.csv file contains the data with one column for language name and the other for its respective popularity indicating value. Here are the contents of data.csv file:
Language,Popularity
Javascript,100
Python,80
C++,50
Java,70
Alternatively, this is the GitHub link to the data.csv file.
Next, we have the visualizationTemplate.html file which is a Jinja template file. It accepts two data parameters – labels (a sequence of strings, here, the names of programming languages) and popularity (a sequence of numbers, here, the popularity of the languages). It defines an HTML file using “Chart.js” library to visualize the bar chart (Discussing the details of HTML and Chart.js is beyond the scope of this article though).
visualizationTemplate.html: Understanding the file requires the knowledge of Jinja Syntax. Here we used the for loop of jinja to insert the data into data and labels parameters.
HTML
<html>
<head>
<title>Visualization with Jinja</title>
</head>
<body>
<H2>Popularity of different languages</H2>
<canvas id="myVisualization"></canvas>
<script>
var ctx = document.getElementById('myVisualization').getContext('2d');
new Chart(ctx, {
type: 'bar',
data: {
labels: [{%for x in labels%}"{{x}}",{%endfor%}],
datasets: [{
label: "Year 2023",
data: [{%for d in popularity%}{{d}},{%endfor%}],
borderwidth: 1
}]
},
options: {scales: {y:{beginAtZero: true}}}
});
</script>
</body>
</html>
|
Finally, we have the renderer.py file which hosts a flask app (named dataApp) that loads the data using pandas, renders the visualizationTemplate.html template file with the loaded data using “render_template()” function from flask and serves the webpage showing the data visualization on the route – “localhost:5000/lanuguagePopularity”.
renderer.py: This is a Flask web application that reads data from a CSV file and displays language popularity using a specified HTML template when accessed via the /languagePopularity route. It primarily serves as a simple data visualization application.
Python3
from flask import Flask, render_template
import pandas
dataApp = Flask(__name__)
@dataApp.route('/languagePopularity')
def languagePopularity():
data = pandas.read_csv('data.csv')
return render_template('visualisationTemplate.html',
labels = data.Language,
popularity = data.Popularity)
if __name__ == '__main__':
dataApp.run(debug=True)
|
Output
Running the above file starts the flask server (in debug mode) at the port 5000 of the localhost. Once started, visit the link
http://127.0.0.1:5000/languagePopularity
on the browser to see the following output containing the data visualization-
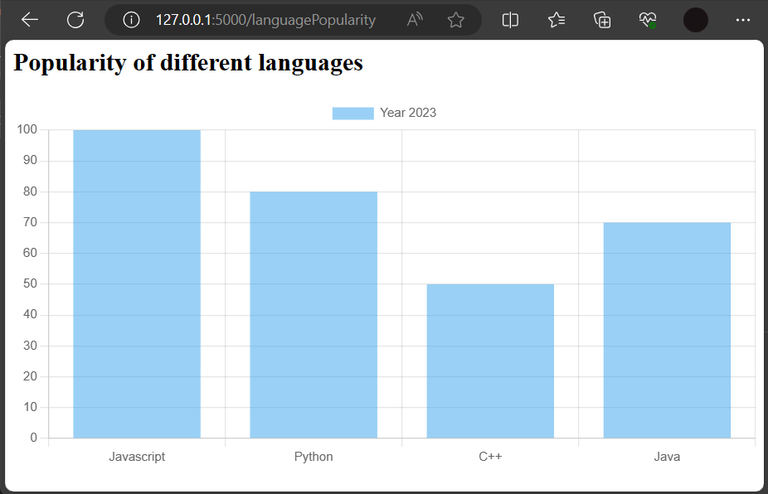
An HTML web page rendered using Jinja containing a data visualization seen on a browser.
Conclusion
In this article we saw how use Jinja for Data Visualization. It involves choosing a software which renders pages using text files. Then we generate the text files for the chosen software containing the visualizations of our data using Jinja. Define a Jinja template that generates the specified type of text file. Then load the data and render the Jinja template with this data to generate the specified text file which can finally be processed and seen with the chosen software. For example, if we decide to visualize our data on browser, we can generate HTML files (that may or may not contain JavaScript) that visualize the data using Jinja and Python.
Share your thoughts in the comments
Please Login to comment...