How to Use Crashlytics Console in Firebase?
Last Updated :
05 Dec, 2022
Firebase has an awesome tool baked right in the middle of its vast feature set, called the Firebase Crashlytics, it works just awesome and is more than just a normal crash-detecting feature, it leverages a whole new level of crash and issues identification, it also provides useful metrics to work with your application to work out with errors faster and work in record time.
Once Crashlytics is operational in your app, you can access it via the Firebase Console’s ‘Quality’ section and begin reviewing the reports as they are received. You have not correctly configured Crashlytics in your app if this page still asks you to set up, create, or launch your application.
You can also determine and set preset values when the console alerts you when a crash occurs in your application, you can specify various tangents and trigger events too to sort and granulate things too!
Like the other articles in this series let’s look out at the key functionalities which Crashlytics offers us, and what this Firebase Component has in for us.
|
Particulars
|
Features
|
| Remedies for the typical crash |
Firebase crashlytics has a vast suite of tools, one for every error, error code, various bug fixes, and a vast directory of common issues and their resolution. All of them work hand in hand to provide you utmost level of comfort with your work. |
| Works in hand with Analytics |
Your app’s mistakes can be recorded by Crashlytics as app exception events in Analytics. The events make debugging easier by allowing you to fetch Analytics information for users that have crashes and by giving you access to a list of other events that preceded each crash. |
| Crash report compilations |
In order to help you identify the root cause more quickly, Crashlytics synthesis an avalanche of crashes into a manageable list of issues gives contextual information, and highlights the severity and occurrence of crashes. |
| Dedicated alert system |
You can also receive critical issue alerts on your devices in real-time so you can work on them, even on the go. |
This list is cohesive and works for most of us, it’s detailed, granulated, and efficient for most of us. Let’s see how we work with issues because that’s the most vital thing we are addressing here in this section.
Let’s Handle Issues
Firebase has compiled all of your app’s reports into issues, where each issue corresponds to a distinct crash or stack trace in your app. One of the problems seen in the provided example stems from CrashTest.java, the Android module in charge of testing Crashlytics through the crash function, which throws an uncaught exception and causes the app to crash. The same issue will always receive more reports when using this strategy on the same platform.
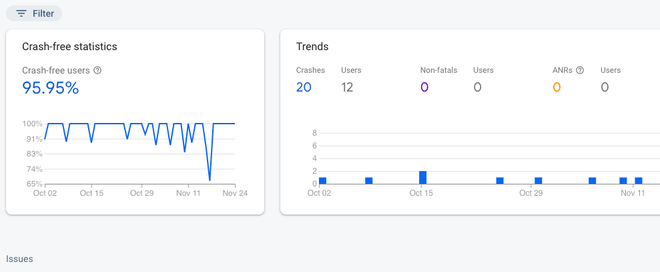
Image #1: The Dashboard of Crash & Issues.
Solving Problems
Take note of the “Close” button in the top right corner. By selecting “Open” under “Issue state” when clicking the “Filter issues” button after an issue has been resolved, you can filter it out of the overview. This is evident in the first case, where we’re showing just three of the 12 significant non-fatal incidents that happened. The same problem will automatically reopen if it happens again. This can be stopped by muting the problem by clicking the arrow next to the button.
Let’s see the implementation path of this function:
There are 3 simple steps to work
Step #1: Connect your app to Firebase
Like all the other articles, we start by connecting our project to firebase. To begin, in the Firebase console, add Firebase to your app.
Step #2: Connecting the Crashlytics in your Project
Crashlytics begins gathering reports as soon as the Crashlytics SDK is added by CocoaPods, Gradle, or Pub.
Step #3: Start seeing the project reports
After this step you will be ready to work with your crash scores in detail, like the one depicted in the image below, you can also click on any result to see a detailed view.
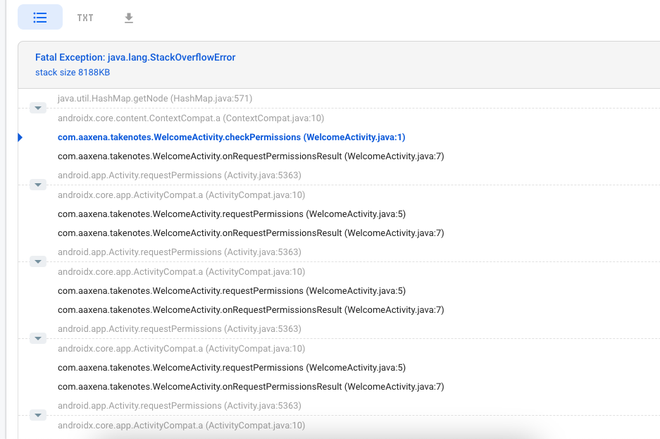
Image #2: The detailed view of a crash.
Conclusion
This is firebase crashlytics and this is them in action, you can too start to work on them and then try them in one of your projects, When the UI thread of an Android app is blocked for an excessive amount of time, the Firebase Team enables the ability to gather Application Not Responding (ANR) issues. For more information on ANR, visit the Android developer documentation.
In order for your react native application to collect ANR, you must be running at least version 13.0.1 of this library, which was added to Android Crashlytics in version 18.2.4.
Share your thoughts in the comments
Please Login to comment...