Chart.js Mixed Chart Types
Last Updated :
05 Dec, 2023
Chart.js mixed Chart Type is a single graphical representation in which multiple chart types are combined. Examples are line, bar, radar, and doughnut in a single chart. It will help to differentiate data with proper visualization. In this article, we will learn about the Mixed Chart Types in Chart.js.
NOTE: When creating a mixed chart, we specify the chart type on each dataset.
Syntax
new Chart(document.getElementById("chartID"), {
    type: 'bar', // primary chart type
    data: {
        labels: ['Label1', 'Label2', 'Label3'],
        datasets: [{
            type: 'line', // specifying a different chart type
            data: [value1, value2, value3],
            // additional line chart configurations
        }, {
            type: 'bar', // another chart type
            data: [value4, value5, value6],
            // additional bar chart configurations
        }]
    },
    options: {
        // chart options
    }
});
Drawing Order:
The default drawing order of datasets is such that the first one is displayed at the top. This order can be changed by specifying the “order” option for datasets, which defaults to 0.
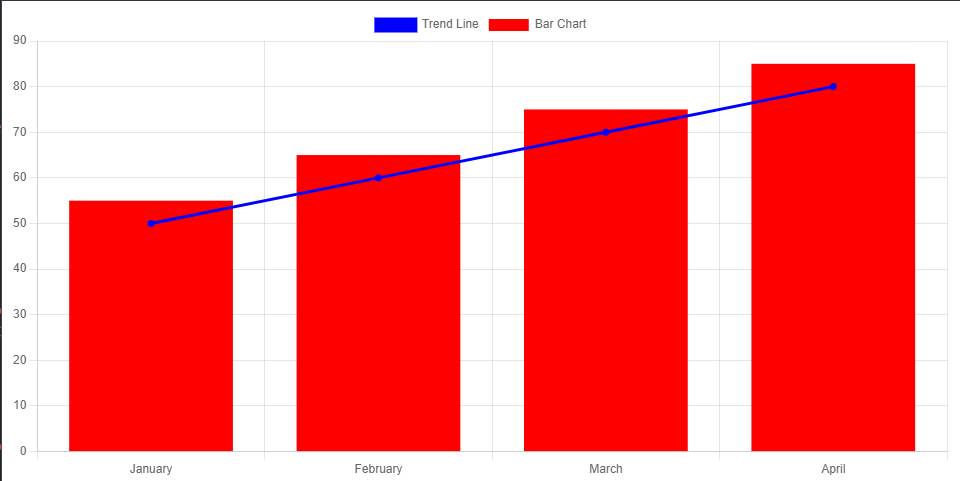
Example 1: In this Example, we will combine Line and Bar Charts. Bar chart is showing the numericals values and similary the line chart is also showing the numberical values.
HTML
<!DOCTYPE html>
<html lang="en">
<head>
<meta charset="UTF-8">
<meta name="viewport"
content="width=device-width, initial-scale=1.0">
<title>Mixed Chart Example with Chart.js</title>
</script>
</head>
<body>
<canvas id="mixedChart"></canvas>
<script>
let ctx =
document.getElementById('mixedChart').getContext('2d');
let mixedChart = new Chart(ctx, {
type: 'bar',
data: {
labels: ['January', 'February', 'March', 'April'],
datasets: [{
type: 'line',
label: 'Trend Line',
data: [50, 60, 70, 80],
backgroundColor: 'blue',
borderColor: 'blue'
}, {
type: 'bar',
label: 'Bar Chart',
data: [55, 65, 75, 85],
backgroundColor: 'red'
}]
},
options: {
scales: {
yAxes: [{
ticks: {
beginAtZero: true
}
}]
}
}
});
</script>
</body>
</html>
|
Output:
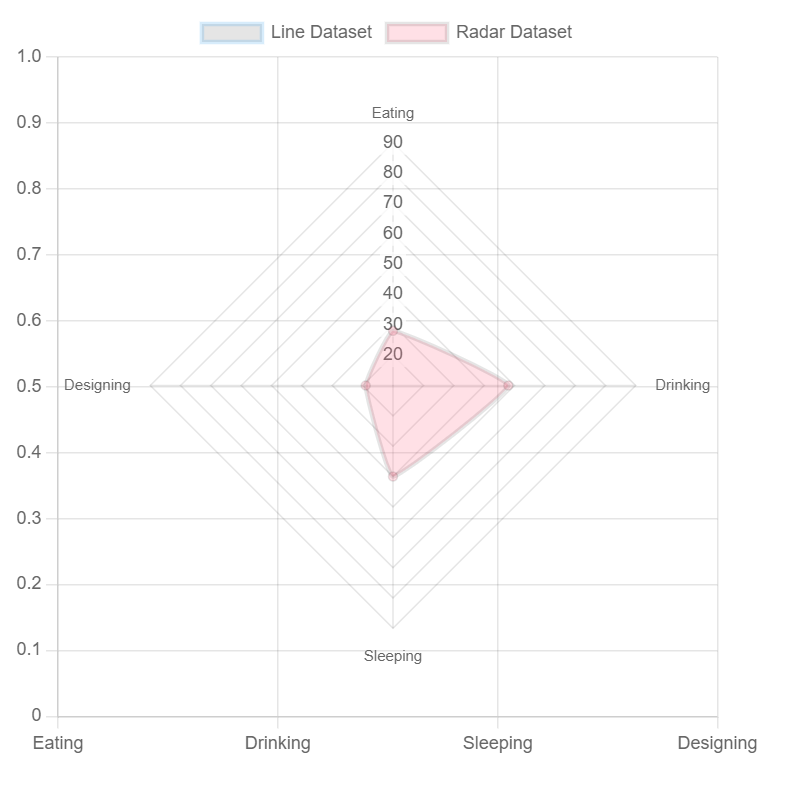
Example 2: In this Example, Line and Radar Chart will be combined. The radar chart segment displays data on activities like Eating, Drinking, Sleeping, and Designing, while the line chart segment overlays this with a separate set of data points, allowing for a multi-dimensional analysis of the given information.
HTML
<!DOCTYPE html>
<html lang="en">
<head>
<meta charset="UTF-8">
<meta name="viewport"
content="width=device-width, initial-scale=1.0">
<title>
Mixed Radar and Line Chart Example
with Chart.js
</title>
</head>
<body>
<canvas id="myMixedChart"></canvas>
<script>
let ctx = document.getElementById('myMixedChart')
.getContext('2d');
let mixedChart = new Chart(ctx, {
type: 'radar', // primary chart type is set to radar
data: {
labels: ['Eating', 'Drinking',
'Sleeping', 'Designing'],
datasets: [{
type: 'line', // line chart dataset
label: 'Line Dataset',
data: [65, 59, 80, 81],
fill: true,
borderColor: 'rgba(54, 162, 235, 0.2)'
}, {
type: 'radar', // radar chart dataset
label: 'Radar Dataset',
data: [28, 48, 40, 19],
backgroundColor: 'rgba(255, 99, 132, 0.2)'
}]
},
options: {
elements: {
line: {
tension: 0.1 // disables bezier curves
}
}
}
});
</script>
</body>
</html>
|
Output:
Share your thoughts in the comments
Please Login to comment...