How to set axes labels & limits in a Seaborn plot?
Last Updated :
14 Sep, 2021
In this article, we will learn How to set axes labels & limits in a Seaborn plot. Let’s discuss some concepts first.
- Axis is the region in the plot that contains the data space. The Axes contain two or three-axis(in case of 3D) objects which take care of the data limits.
- Axes Labels are the labels that describe the axes’ values in terms of meaning, units, and direction.
- Axes Limits are the limits to the axes’ values, which are used to filter for a required value on axes.
Here, In this article, the content goes from setting the axes labels, axes limits, and both at a time. In the end, you will be able to learn how to set axes labels & limits in a Seaborn plot.
Set axes labels
Method 1: To set the axes label in the seaborn plot, we use matplotlib.axes.Axes.set() function from the matplotlib library of python.
Syntax: Axes.set(self, xlabel, ylabel, fontdict=None, labelpad=None, **kwargs)
Parameters:
- xlabel : str- The label text for the x-axis.
- ylabel : str- The label text for the y-axis.
- labelpad : scalar, optional, default: None
- **kwargs : Text properties
Returns: It will change the x-axis and y-axis labels.
Example: In this example, we will use single matplotlib.axes.Axes.set() function and change the label of the with a single call of this function, and we will pass both the xlabel and ylabel parameters in one go and this will change the user plot.
Python3
import seaborn as sns
sns.set_style("whitegrid")
tips = sns.load_dataset("tips")
gfg = sns.boxplot(x ="day", y ="total_bill", data = tips)
gfg.set(xlabel ="GFG X", ylabel = "GFG Y", title ='some title')
|
Output:

Method 2: To set the axes label in the seaborn plot, we use matplotlib.axes.Axes.set_ylabel() and matplotlib.axes.Axes.set_xlabel() function from the matplotlib library of python.
Syntax:
Axes.set_xlabel(self, xlabel, fontdict=None, labelpad=None, **kwargs)
Axes.set_ylabel(self, xlabel, fontdict=None, labelpad=None, **kwargs)
Parameters: This method accepts the following parameters.
- xlabel : This parameter is the label text.
- labelpad : This parameter is the spacing in points from the axes bounding box including ticks and tick labels.
Returns:This method does not return any value.
Example: In this example, we will use matplotlib.axes.Axes.set_ylabel() and matplotlib.axes.Axes.set_xlabel() function separately and pass the name of the label as the parameter to change the label of the plot.
Input:
Python3
import seaborn as sns
sns.set_style("whitegrid")
tips = sns.load_dataset("tips")
gfg = sns.boxplot(x ="day", y ="total_bill", data = tips)
gfg.set_title( "GFG - GFG")
gfg.set_xlabel( "GFG X")
gfg.set_ylabel( "GFG Y")
|
Output:

Set axes limits
Functions for changing the limits:-
- matplotlib.axes.Axes.set_xlim() Function: axes module of matplotlib library is used to set the x-axis view limits.
- matplotlib.axes.Axes.set_ylim() Function: axes module of matplotlib library is used to set the y-axis view limits.
Syntax:
Axes.set_xlim(self, left=None, right=None, emit=True, auto=False, *, xmin=None, xmax=None)
Axes.set_ylim(self, bottom=None, top=None, emit=True, auto=False, *, ymin=None, ymax=None)
Parameters:
- bottom: This parameter is the bottom xlim/ylim in data coordinates
- top: This parameter is the top xlim/ylim in data coordinates
- emit: This parameter is used to notify observers of limit change.
- auto: This parameter is used to turn on autoscaling of the x-axis/y-axis.
- xmin, xmax, ymin, ymax: These parameters are equivalent to bottom and top and it is an error to pass both xmin/ymin and bottom or xmax/ymax and top.
Returns: bottom, top: This returns the new x-axis/y-axis limits in data coordinates.
Example:
Python3
import matplotlib.pyplot as plt
import seaborn as sns
data = [3, 7, 9, 11, 12, 14, 15, 16, 18, 19, 20, 23, 25, 28]
fig, ax = plt.subplots()
sns.distplot(data, ax = ax)
ax.set_xlim(1, 70)
plt.show()
|
Output:

Set axes labels and axes limits
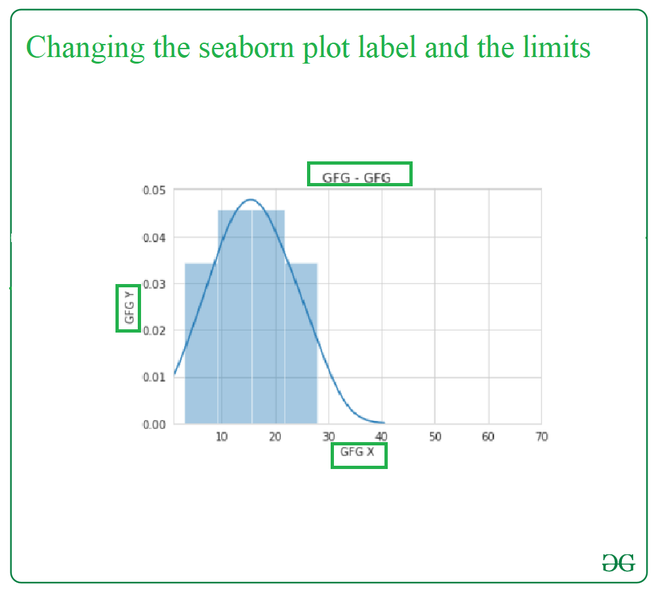
In this particular example, we will be changing the label and the limit of the plot in a single code with the help of the suitable required functions of the python library.
Python3
import matplotlib.pyplot as plt
import seaborn as sns
data = [3, 7, 9, 11, 12, 14, 15, 16, 18, 19, 20, 23, 25, 28]
fig, ax = plt.subplots()
sns.distplot(data, ax = ax)
ax.set_xlim(1, 70)
ax.set_xlabel( "GFG X")
ax.set_ylabel( "GFG Y")
ax.set_title( "GFG - GFG")
plt.show()
|
Output:
Share your thoughts in the comments
Please Login to comment...