How to Increase Spacing Between Legend and Chart ?
Last Updated :
05 Jan, 2024
In this article, we will learn how to increase the spacing between a legend and a chart using the ChartJS CDN library.
Approach
- Use the <canvas> tag to show the bar graph in the HTML template.
- In the script section of the code, instantiate the ChartJS object by setting the type, data, and options properties of the library.
- Set other required options inside each property like datasets, label, borderColor, fill, scales, and others.
- In ChartJS, you can increase the spacing between the legend and the chart by defining a custom plugin to override the original fit function. The fit function is a part of the chart.legend.fit.
- First, call the original fit function and bind the scope to use this operator correctly. Then, simply append the height variable with the desired value of the user to increase the height between the legend and the chart.
CDN Link:
<script src="https://cdn.jsdelivr.net/npm/chart.js"></script>
Syntax:
const plugin = {
    beforeInit(chart) {
        // Get a reference to the original fit function
        const origFit = chart.legend.fit;
        chart.legend.fit = function fit() {
            origFit.bind(chart.legend)();
            // Change the height to any desired value
            this.height += 10;
        }
    }
}

const chart = document.getElementById('myChart');
new Chart(chart, {
    type: 'bar',
    data: { ... },
    plugins: [plugin]
});
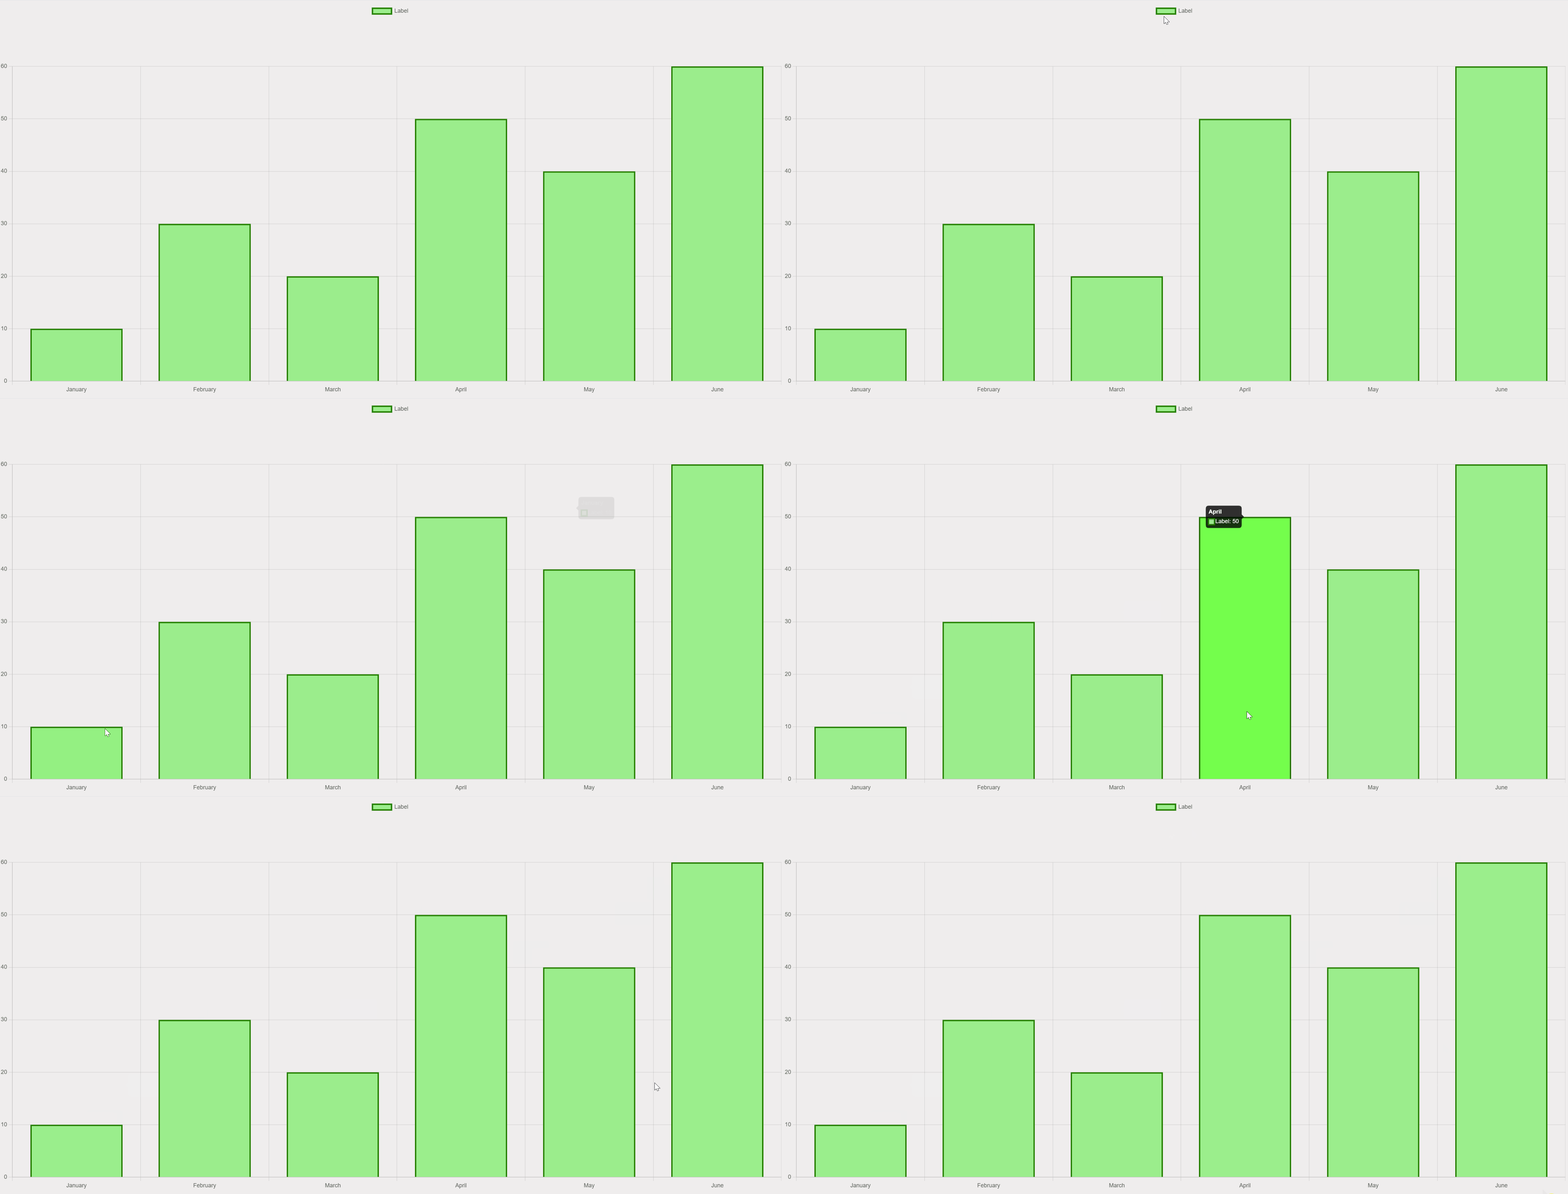
Example: The following code shows a simple example of a bar chart showcasing a sample dataset with a list of months of the year on the x-axis and a number dataset on the y-axis.
HTML
<!DOCTYPE html>
<html lang="en">
<head>
<meta charset="UTF-8">
<meta name="viewport"
content="width=device-width, initial-scale=1.0">
<style>
body {
background-color: rgb(239, 237, 237);
}
</style>
<title>Chart</title>
</head>
<body>
<div>
<canvas id="myChart"></canvas>
</div>
<script src=
</script>
<script>
const plugin = {
beforeInit(chart) {
const originalFit = chart.legend.fit;
chart.legend.fit = function fit() {
originalFit.bind(chart.legend)();
this.height += 50;
}
}
}
const ctx = document.getElementById('myChart');
new Chart(ctx, {
type: 'bar',
data: {
labels: ['January', 'February', 'March',
'April', 'May', 'June'],
datasets: [{
label: 'Label',
data: [10, 30, 20, 50, 40, 60],
borderWidth: 3,
backgroundColor: 'lightgreen',
borderColor: 'green',
}]
},
// Insert the custom plugin in chart
plugins: [plugin]
});
</script>
</body>
</html>
|
Output:

Share your thoughts in the comments
Please Login to comment...