How to implement unsupervised learning tasks with TensorFlow?
Last Updated :
20 Mar, 2024
In this article, we are going to explore how can we implement unsupervised learning tasks using TensorFlow framework. Unsupervised learning, a branch of machine learning, discovers patterns or structures in data without explicit labels. TensorFlow users can explore diverse unsupervised learning techniques such as clustering, dimensionality reduction, and generative modelling.
To implement unsupervised learning tasks with TensorFlow, we can use various techniques such as autoencoders, generative adversarial networks (GANs), self-organizing maps (SOMs), or clustering algorithms like K-means. There are some steps to follow to implement tasks, as follows:
- Choose an Unsupervised Learning Technique
- Prepare Data
- Build Model
- Define Loss Function and Optimizer
- Train Model
- Evaluate Model
- Prediction
How to choose an Unsupervised Learning Technique?
Select the specific unsupervised learning technique that best suits your problem. For example, if you want are provided with unlabeled data and you want to create a particular category you can perform clustering using K-means, if you want to learn meaningful representations from unlabeled data, autoencoders could be a good choice. If you want to generate new data samples, you might consider using GANs. Some popular unsupervised learning techniques are.
- K-means is a simple and popular clustering algorithm that partitions data into K clusters based on similarity.
- Autoencoders are neural networks that aim to learn efficient representations of input data by reconstructing it from a compressed representation.
- GANs consist of two neural networks, a generator and a discriminator, which are trained simultaneously. The generator learns to generate realistic data samples, while the discriminator learns to distinguish between real and fake samples.
- SOMs are neural networks that learn to map high-dimensional data onto a lower-dimensional grid while preserving the topological properties of the input space.
- PCA is a dimensionality reduction technique that identifies the principal components (orthogonal directions) that capture the maximum variance in the data.
Implementing K-means using TensorFlow
Unsupervised learning tasks, such as clustering, can be implemented using TensorFlow. One popular clustering algorithm is K-means.
1. Import required libraries
- We import TensorFlow as tf to utilize its computational graph capabilities.
- We also import numpy to generate random data points and matplotlib.pyplot for visualization.
Python
import tensorflow as tf
import numpy as np
import matplotlib.pyplot as plt
2. Generate random data points
- We specify the number of samples (num_samples), number of features (num_features), and number of clusters (num_clusters).
- Using np.random.randn, we generate random data points of shape (num_samples, num_features).
- These data points represent our dataset on which K-means clustering will be performed.
Python
num_samples = 200
num_clusters = 3
num_features = 2

data_points = tf.constant(np.random.randn(num_samples, num_features), dtype=tf.float32)
3.Initialize centroids
- We initialize centroids randomly by shuffling the data points and selecting the first num_clusters points as centroids.
- Centroids are represented as a TensorFlow variable, allowing their values to be updated during the iterative optimization process.
Python
centroids = tf.Variable(tf.slice(tf.random.shuffle(data_points), [0, 0], [num_clusters, -1]))
for _ in range(100):
4. Assign nearest centroid
- We calculate the Euclidean distances between each data point and all centroids.
- Using tf.argmin, we determine the index of the nearest centroid for each data point based on the calculated distances.
- Data points are assigned to the centroid with the minimum distance.
Python
distances = tf.reduce_sum(tf.square(tf.subtract(tf.expand_dims(data_points, axis=1), centroids)), axis=2)
assignments = tf.argmin(distances, axis=1)
5. Update centroids based on the mean of assigned data points
- For each centroid, we compute the mean of the data points assigned to it.
- The mean represents the new centroid position, which will better represent the cluster.
Python
new_centroids = []
for i in range(num_clusters):
    assigned_data_points = tf.boolean_mask(data_points, tf.equal(assignments, i))
    new_centroids.append(tf.reduce_mean(assigned_data_points, axis=0))
centroids.assign(new_centroids)
6. Repeat steps 4 and 5 until convergence
- Steps 4 and 5 are repeated iteratively until convergence criteria are met.
- Typically, convergence is achieved when there is minimal change in centroid positions between iterations or after a predefined number of iterations.
7. Plot the Results
Visualize the data points and centroids on a scatter plot.
Python
plt.scatter(data_points[:, 0], data_points[:, 1], c=assignments, cmap='viridis')
plt.scatter(centroids[:, 0], centroids[:, 1], marker='^', c='r', s=100)
plt.title('K-means Clustering')
plt.xlabel('Feature 1')
plt.ylabel('Feature 2')
plt.show()
Output:
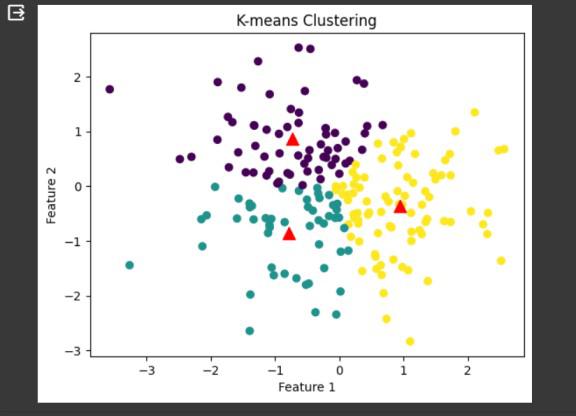
K-means Clustering
This code performs K-means clustering on randomly generated data points and visualizes the clusters and centroids using Matplotlib. It demonstrates the process of clustering data into a specified number of clusters based on the distances between data points and centroids, iteratively updating the centroids until convergence. Each step has contributed to shaping a powerful tool for understanding and transforming data into actionable insights.
Share your thoughts in the comments
Please Login to comment...