How To Generate Periodic and Aperiodic Sequence in MATLAB?
Last Updated :
18 Feb, 2023
The signal is an electric or electromagnetic current carrying data, that can be transmitted or received. Mathematically represented as a function of an independent variable e.g. density, depth, etc. Therefore, a signal is a physical quantity that varies with time, space or any other independent variable by which information can be conveyed
- Periodic Sequence: A discrete-time signal x(n) is said to be periodic with period N if only if x(N+n)=x(n) for all n
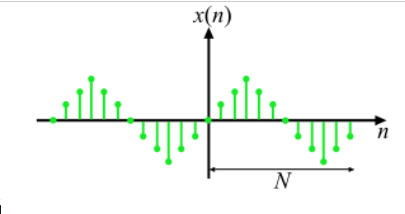
Periodic Sequence
- Aperiodic Sequence: If the above periodic sequence equation does not satisfy even for one value of n, then the discrete-time signal is aperiodic as shown in the figure below
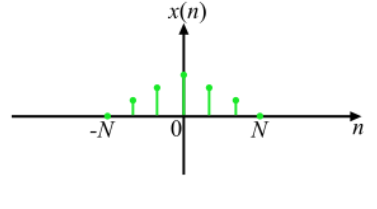
Aperiodic Sequence
Example 1:
Matlab
clear all
n=0:1:50;
n1=0:1:50;
x1=sin(.2*pi*n);
x2=sin(.4*pi*n);
x3=sin(.2*pi*n)+sin(.4*pi*n);
x4=sin(.5*n1);
subplot(2,2,1);
s1=stem(n,x1);
s1.Color='green';
xlabel('n'),ylabel('x1(n)')
axis([0 50 -1 1])
subplot(2,2,2);
s2=stem(n,x2);
s2.Color='green';
xlabel('n'),ylabel('x2(n)')
axis([0 50 -1 1])
subplot(2,2,3);
s3=stem(n,x3);
s3.Color='green';
xlabel('n'),ylabel('x3(n)')
axis([0 50 -2 2])
subplot(2,2,4);
s4=stem(n1,x4);
s4.Color='green';
xlabel('n'),ylabel('x4(n)')
axis([0 50 -1 1])
|
Output:
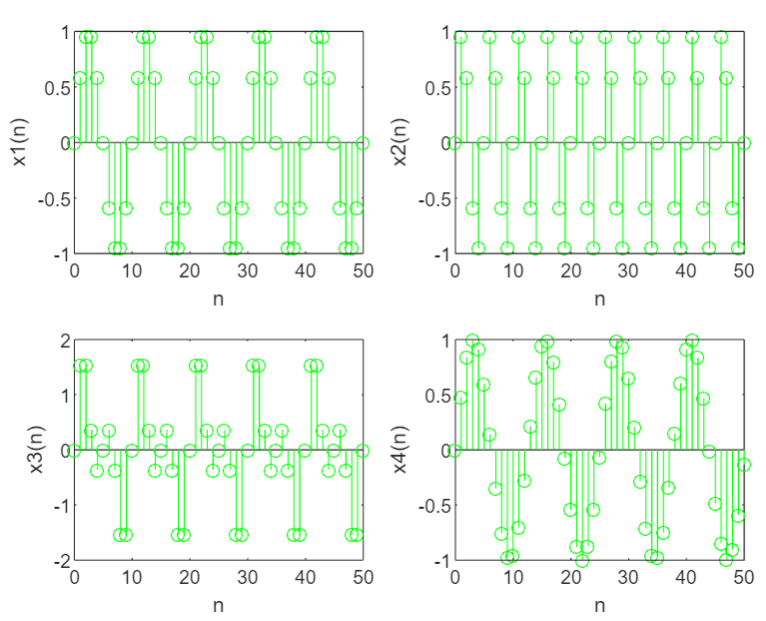
x1(n) & x2(n) Periodic Signals and x3(n) & x4(n) Aperiodic Signals
Share your thoughts in the comments
Please Login to comment...