Tcpdump is the command line tool that allows the user to capture and analyze network traffic by intercepting and displaying packets that are being created and received by the user’s system. It allows users to capture and inspect network traffic in real-time as it passes through a network interface.
Features:
- Packet Capture: Tcpdump can capture packets traversing a network interface, making it possible to analyze the content of data packets, including headers and payloads.
- Protocol Analysis: It can decode and display packets for a wide range of network protocols, such as TCP, UDP, ICMP, HTTP, FTP, and more. This makes it a versatile tool for debugging and monitoring network communications.
- Filter and Display: Tcpdump allows users to apply filters to capture only specific types of packets or traffic originating from particular IP addresses or ports. This selective capturing helps in focusing on specific network events or troubleshooting particular network issues.
- Real-time Monitoring: Tcpdump displays captured packets in real-time, enabling administrators to monitor network activity as it happens. This is especially useful for diagnosing network problems and detecting suspicious or unexpected traffic patterns.
How to Install Tcpdump on Ubuntu?
Step 1: Open your terminal using All Application or by using the shortcut CTRL + ALT + T.
Opening Terminal
Step 2: Once the terminal is been opened, update the system by executing the below apt command.
sudo apt-get update
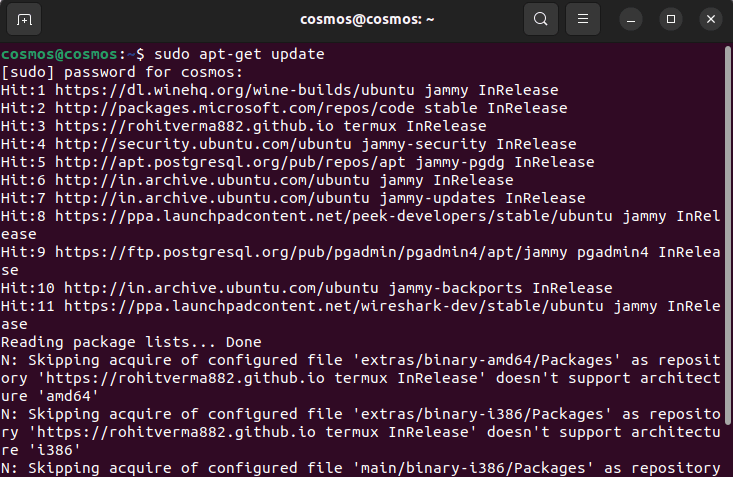
Updating System
Step 3: Now, by using the below command Install tcpdump on the Ubuntu system.
sudo apt-get install tcpdump
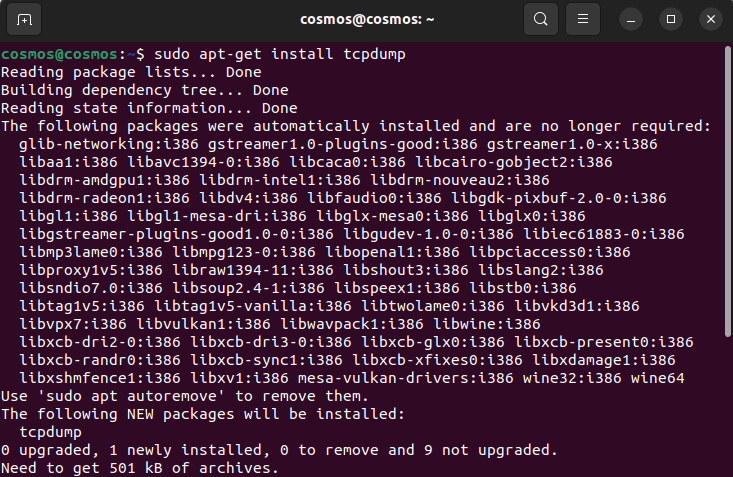
Installing tcpdump tool
For Redhat or Centos:
yum install tcpdump
For Latest version of Redhat we can also use.
dnf install tcpdump
Step 4: After installing tcpdump run the below command to check and to know if the tcpdump has been installed on your system.
tcpdump --version
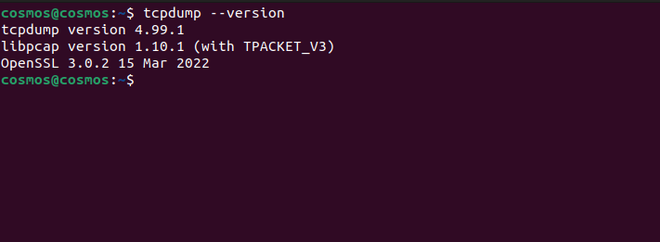
Checking Version
How to capture all the HTTP packets using tcpdump?
Below are the examples through which we can capture all the HTTP packets using tcpdump.
Example 1: Capture a large number of HTTP packets using tcpdump
Tcpdump has a useful feature which is to write packets to a file. This is very handy when you are capturing a large number of packets and want to analyze them.
Step 1: Open your terminal and paste the below command:
sudo tcpdump -n -w file_name.pcap
Here “-w“ option is used which will not display packets on the terminal screen. Tcpdump writes raw packets and creates a binary file but that file cannot be opened with a text editor. Press “ctrl+c” to close the process and the packets before you close the tcpdump will be saved to that file.
Output:
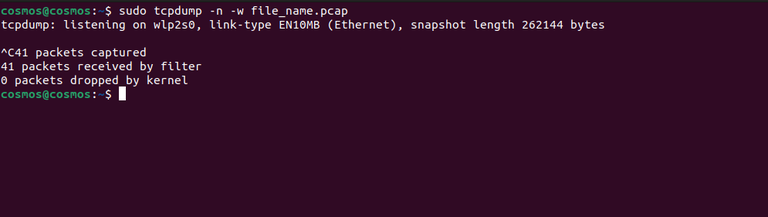
Writing Packets to File
Step 2: Open the folder where you saved the file, open your terminal, and in that directory write the below command-
sudo tcpdump -r file_name.pcap
- -r: In the command we have used ‘-r‘ which means read <file_name.pcap>. It is important to use ‘-r‘ whenever you want to read .pcap files.
After this, you will see all the packets you had saved before closing the connection.
Output:
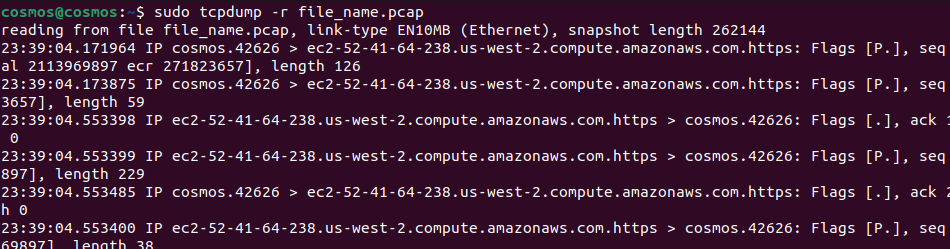
Reading Packets from File
Example 2: Capture a limited number of HTTP packets
Step 1: To save a limited number of packets to the file, we use the “-c” option followed by the number of packets you want to save. Here ’20’ defines the number of packets we want to capture. You can set the number of the packets you want to capture, this is useful when an individual wants to inspect a limited number of packets.
sudo tcpdump -n -c 20 -w file_name.pcap
- –c: In the following command we have used the ‘-c’ option which means COUNT. ‘-c’ counts the number of packets the user wants to capture. This option is used whenever a user wants to capture a specific number of packets.
- -w: This option is used to WRITE packets in the file. ‘-w’ is followed by the <filename.pcap>.
Output:
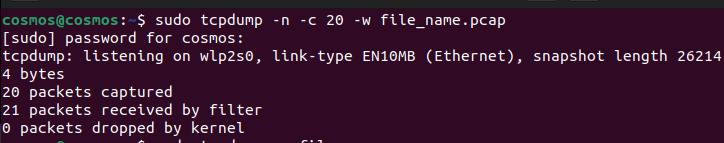
Capture a limited number of HTTP packets
Step 2: Again, use the same command to inspect the packets you have captured:
sudo tcpdump -r file_name.pcap
Example 3: Capture All incoming HTTP GET traffic or Requests
Step 1: To perform any operation using tcpdump it is important to know your system interface and server IP. To know the system interface and server IP run the below command:
ifconfig -a

Checking Interface
Step 2: Use the below command to capture All HTTP GET traffic or Requests. Note, change the interfaces that is my case “enxae1573c204dd” with your interface. The interface is important so that it will only capture the interface that is receiving on that particular interface. Here “0x47455420” means GET if we convert the following hexadecimal in ASCII value.
tcpdump -i <system_interface> -s 0 -A 'tcp[((tcp[12:1] & 0xf0) >> 2):4] = 0x47455420'
- -i: Here -I mean interface followed by the name of the interface. If a user wants to capture packets on a specific interface we have to use ‘-i‘ followed by the intername.
Note: Here 0x47455420 depicts the ASCII value of characters ‘G’ ‘E’ ‘T’ ‘ ‘
Output:

Capture All incoming HTTP GET traffic or Requests
Example 4: Capture All incoming HTTP POST requests
Use the command the capture All incoming HTTP POST requests. This commands all the POST requests which are been received on your interface.
tcpdump -i <system_interface> -s 0 -A 'tcp[((tcp[12:1] & 0xf0) >> 2):4] = 0x504F5354'
- Here ‘0x504F5354’ depicts POST which means it will only capture incoming POST requests on the specified interface.
- -s: this option specifies the snaplen which is ‘0’ defined in the below command.
- “(tcp[12:1] & 0xf0) >> 2)” extracts the Data Offset field and multiplies it by 4 to get us the size of the TCP header in bytes.
Output:
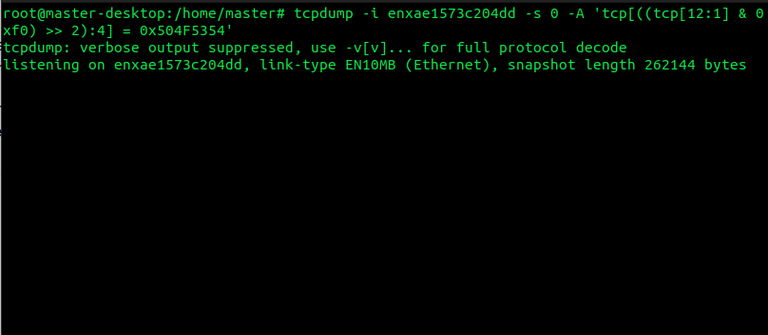
Capture All incoming HTTP POST requests
Note: Here 0x504F5354 represents the ASCII value of ‘P’ ‘O’ ‘S’ ‘T’
Example 5: Capture only HTTP GET requests Incoming to port 80 ( Apache/NGINX)
Capturing HTTP GET requests incoming to port 80 which is the default port for localhost from Apache/NGINX. When we locally host a website and want to inspect the GET requests coming from Apache, this command is useful for accomplishing that work.
Use the below command to capture GET requests from the Apache/NGINX:
tcpdump -i enxae1573c204dd -s 0 -A 'tcp dst port 80 and tcp[((tcp[12:1] & 0xf0) >> 2):4] = 0x47455420'
- When starting the local server it will start showing the HTTP GET requests on port 80 and you can inspect those packages.
- ‘0x47455420‘ depicts GET in ASCII value and is used to capture GET requests
- remember interface may change in your case
Note: Change the “enxae1573c204dd” to your system interface.
Output:

Capture only HTTP GET requests Incoming to port 80 ( Apache/NGINX)
Example 6: Capture only HTTP POST requests Incoming to port 80 ( Apache/NGINX)
When creating websites that take input from the user and then store the information in the database the following is done using a POST request. To check the POST requests that you are incoming to port 80 on the Apache/NGINX localhost server the below command is used.
tcpdump -i <system_interface> -s 0 -A 'tcp dst port 80 and tcp[((tcp[12:1] & 0xf0) >> 2):4] = 0x504F5354'
- ‘0x504F5354’ depicts POST in ASCII value which tells tcpdump to capture only POST request
- ‘PORT 80’ specifies the port to capture the POST request to PORT 80.
Note: Change the system interface to get results, it will return an error.
Output:

Capture only HTTP POST requests Incoming to port 80 ( Apache/NGINX)
Example 7: Capture both HTTP GET (or) POST Incoming calls to port 80 (or) 443 ( Apache/NGINX) Originating from 192.168.253.58 Local Host
Locally hosting a website and inspecting both GET and POST incoming calls is quite complex without the help of tcpdump. Tcpdump allows you to capture both HTTP GET or POST incoming calls to your local port on Apache/NGINX.
tcpdump -i <interface> -s 0 -A 'tcp dst port 80 or tcp dst port 443 and tcp[((tcp[12:1] & 0xf0) >> 2):4] = 0x47455420 or tcp[((tcp[12:1] & 0xf0) >> 2):4] = 0x504F5354' and host <ip_address>
- <ip_address>: To know your IP address run the command ‘ifconfig -a‘ it will show the IP address and also the name of the interface.
- Here ‘0x504F5354‘ and ‘0x47455420 ‘ : depict POST and GET in their ASCII values, which are used to get either the GET or POST calls incoming to the PORT 80 and on the HOST.
Output:

Capture both HTTP GET (or) POST Incoming calls to port 80 (or) 443 ( Apache/NGINX) Originating from 192.168.253.58 Local Host
Example 8: Capture a Complete HTTP Transmission of incoming and outgoing GET and POST
This command is useful usually when a person hosts a page on its local server and that person wants to track the HTTP request and response between the server and client. This command of Tcpdump allows to capture of the HTTP request and response between the server and the client.
tcpdump -i <system_interface> -s 0 -A 'tcp dst port 80 and tcp[((tcp[12:1] & 0xf0) >> 2):4] = 0x47455420 or tcp[((tcp[12:1] & 0xf0) >> 2):4] = 0x504F5354 or tcp[((tcp[12:1] & 0xf0) >> 2):4] = 0x48545450 or tcp[((tcp[12:1] & 0xf0) >> 2):4] = 0x3C21444F and host <ip_address>
- ‘0x3C21444F‘ represents the ASCII value of ‘<‘ ‘D’ ‘O’ ‘C’ this is to capture the outgoing HTML file, that is necessary to capture the complete HTTP transmission.
- ‘0x48545450‘ represents the ASCII value of ‘H’ ‘T’ ‘T’ ‘P’ this is to capture the outgoing HTTP traffic (HTTP response).
Output:

Capture a Complete HTTP Transmission of incoming and outgoing GET and POST
Example 9: Filter HTTP User Agents using Tcpdump
The filter allows to capture of only the packets that a user wants to capture. It is just like filtering unwanted packets and capturing the packets or the information a user wants from incoming calls. These filter properties of Tcpdump make this tool efficient and useful for sniffing the website.
tcpdump -vvAls0 | grep 'User-Agent:'
- grep ‘User-Agent:’ : ‘grep‘ matches the text and shows the relevant output. We have used ‘grep ‘User-Agent” which will only capture the packets that match with the ‘User-Agent’.
Output:
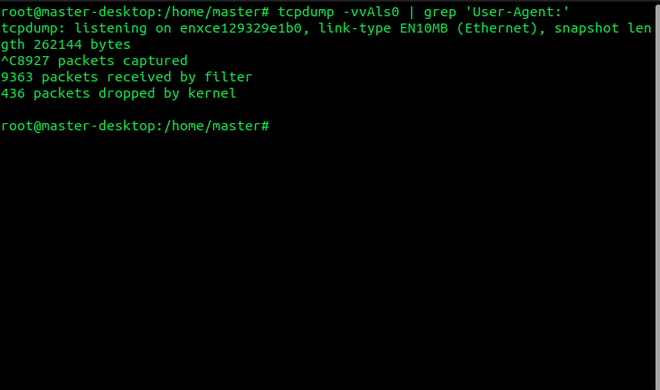
Filter HTTP User Agents using Tcpdump
Example 10: Capture the Cookies from the Server and Client
Tcpdump allows to capture of ‘Cookies’ from the server and from the client side. It is also a filter property that filters the unnecessary information in the packets and only shows ‘Cookie‘.
Using this filter property is quite simple and after executing the command only the necessary packets will be filtered by the Tcpdump.
sudo tcpdump -nn -A -s0 -l | egrep -i 'Set-Cookie|Host:|Cookie:'
- ‘egrep -i ‘Set-Cookie|Host:|Cookie:’ : egrep is the pattern searching command which belongs to the family of grep function.
Output:

Capture the Cookies from the Server and Client
Example 11: Capture HTTP Passwords in POST Requests
Tcpdump allows capturing passwords in POST requests. The below command is useful for capturing the password in the HTTP POST requests for inspection.
sudo tcpdump -i any -s 0 -A -n -l | egrep -i "POST /|pwd=|passwd=|password=|Host:"
Output:

Capture HTTP Passwords in POST Requests
Example 12: Detect Port Scan in Network Traffic
This command shows all the traffic which coming through your port.
sudo tcpdump -nn
Output:

Detect Port Scan in Network Traffic
Conclusion
In conclusion, capturing all HTTP packets using tcpdump can be achieved by specifying the desired port, typically port 80, which is the default for HTTP traffic. By using the appropriate command with the -i flag to specify the network interface and the -w flag to save the captured packets to a file, you can effectively monitor and analyze HTTP traffic for diagnostic, security, or auditing purposes. This method allows network administrators and analysts to gain insights into the communication occurring over the HTTP protocol within their network environment.
Share your thoughts in the comments
Please Login to comment...