Analyzing Hotel Booking Patterns in R Programming Langauge involves examining a dataset related to hotel bookings to derive insights into booking trends, customer behavior, and other relevant factors. In this case, the dataset contains columns such as hotel type, cancellation status, lead time, arrival date details, and other booking-related information.
Dataset Link:- Hotel Booking Demand
Load Packages and Data
- First, install and load the required packages.
- Next, read the Dataset and check the first few rows.
R
# Install and load necessary libraries
#install.packages(c("tidyverse", "ggplot2", "forecast"))
library(tidyverse)
library(ggplot2)
library(forecast)
# Load the hotel bookings dataset
hotel_data <- read.csv("Your//path")
head(hotel_data)
Output:
         hotel is_canceled lead_time arrival_date_year arrival_date_month
1 Resort Hotel           0       342              2015               July
2 Resort Hotel           0       737              2015               July
3 Resort Hotel           0         7              2015               July
4 Resort Hotel           0        13              2015               July
5 Resort Hotel           0        14              2015               July
6 Resort Hotel           0        14              2015               July
  arrival_date_week_number arrival_date_day_of_month stays_in_weekend_nights
1                       27                         1                       0
2                       27                         1                       0
3                       27                         1                       0
4                       27                         1                       0
5                       27                         1                       0
6                       27                         1                       0
  stays_in_week_nights adults children babies meal country market_segment
1                    0      2        0      0   BB     PRT         Direct
2                    0      2        0      0   BB     PRT         Direct
3                    1      1        0      0   BB     GBR         Direct
4                    1      1        0      0   BB     GBR      Corporate
5                    2      2        0      0   BB     GBR      Online TA
6                    2      2        0      0   BB     GBR      Online TA
  distribution_channel is_repeated_guest previous_cancellations
1               Direct                 0                      0
2               Direct                 0                      0
3               Direct                 0                      0
4            Corporate                 0                      0
5                TA/TO                 0                      0
6                TA/TO                 0                      0
  previous_bookings_not_canceled reserved_room_type assigned_room_type
1                              0                  C                  C
2                              0                  C                  C
3                              0                  A                  C
4                              0                  A                  A
5                              0                  A                  A
6                              0                  A                  A
  booking_changes deposit_type agent company days_in_waiting_list customer_type
1               3   No Deposit  NULL    NULL                    0     Transient
2               4   No Deposit  NULL    NULL                    0     Transient
3               0   No Deposit  NULL    NULL                    0     Transient
4               0   No Deposit   304    NULL                    0     Transient
5               0   No Deposit   240    NULL                    0     Transient
6               0   No Deposit   240    NULL                    0     Transient
  adr required_car_parking_spaces total_of_special_requests reservation_status
1   0                           0                         0          Check-Out
2   0                           0                         0          Check-Out
3  75                           0                         0          Check-Out
4  75                           0                         0          Check-Out
5  98                           0                         1          Check-Out
6  98                           0                         1          Check-Out
  reservation_status_date
1              2015-07-01
2              2015-07-01
3              2015-07-02
4              2015-07-02
5              2015-07-03
6              2015-07-03
Check the Structure
Let’s check the structure of the dataset .
R
Output:
'data.frame':   119390 obs. of  32 variables:
 $ hotel                         : chr  "Resort Hotel" "Resort Hotel" "Resort Hotel" "Resort Hotel" ...
 $ is_canceled                   : int  0 0 0 0 0 0 0 0 1 1 ...
 $ lead_time                     : int  342 737 7 13 14 14 0 9 85 75 ...
 $ arrival_date_year             : int  2015 2015 2015 2015 2015 2015 2015 2015 2015 2015 ...
 $ arrival_date_month            : chr  "July" "July" "July" "July" ...
 $ arrival_date_week_number      : int  27 27 27 27 27 27 27 27 27 27 ...
 $ arrival_date_day_of_month     : int  1 1 1 1 1 1 1 1 1 1 ...
 $ stays_in_weekend_nights       : int  0 0 0 0 0 0 0 0 0 0 ...
 $ stays_in_week_nights          : int  0 0 1 1 2 2 2 2 3 3 ...
 $ adults                        : int  2 2 1 1 2 2 2 2 2 2 ...
 $ children                      : int  0 0 0 0 0 0 0 0 0 0 ...
 $ babies                        : int  0 0 0 0 0 0 0 0 0 0 ...
 $ meal                          : chr  "BB" "BB" "BB" "BB" ...
 $ country                       : chr  "PRT" "PRT" "GBR" "GBR" ...
 $ market_segment                : chr  "Direct" "Direct" "Direct" "Corporate" ...
 $ distribution_channel          : chr  "Direct" "Direct" "Direct" "Corporate" ...
 $ is_repeated_guest             : int  0 0 0 0 0 0 0 0 0 0 ...
 $ previous_cancellations        : int  0 0 0 0 0 0 0 0 0 0 ...
 $ previous_bookings_not_canceled: int  0 0 0 0 0 0 0 0 0 0 ...
 $ reserved_room_type            : chr  "C" "C" "A" "A" ...
 $ assigned_room_type            : chr  "C" "C" "C" "A" ...
 $ booking_changes               : int  3 4 0 0 0 0 0 0 0 0 ...
 $ deposit_type                  : chr  "No Deposit" "No Deposit" "No Deposit" "No Deposit" ...
 $ agent                         : chr  "NULL" "NULL" "NULL" "304" ...
 $ company                       : chr  "NULL" "NULL" "NULL" "NULL" ...
 $ days_in_waiting_list          : int  0 0 0 0 0 0 0 0 0 0 ...
 $ customer_type                 : chr  "Transient" "Transient" "Transient" "Transient" ...
 $ adr                           : num  0 0 75 75 98 ...
 $ required_car_parking_spaces   : int  0 0 0 0 0 0 0 0 0 0 ...
 $ total_of_special_requests     : int  0 0 0 0 1 1 0 1 1 0 ...
 $ reservation_status            : chr  "Check-Out" "Check-Out" "Check-Out" "Check-Out" ...
 $ reservation_status_date       : chr  "2015-07-01" "2015-07-01" "2015-07-02" "2015-07-02" ...
Check the Summary
Checking the summary of the dataset it provides various information like( min , meadian , mode ,etc)
R
Output:
    hotel            is_canceled       lead_time   arrival_date_year
 Length:119390      Min.   :0.0000   Min.   :  0   Min.   :2015
 Class :character   1st Qu.:0.0000   1st Qu.: 18   1st Qu.:2016
 Mode  :character   Median :0.0000   Median : 69   Median :2016
                    Mean   :0.3704   Mean   :104   Mean   :2016
                    3rd Qu.:1.0000   3rd Qu.:160   3rd Qu.:2017
                    Max.   :1.0000   Max.   :737   Max.   :2017

 arrival_date_month arrival_date_week_number arrival_date_day_of_month
 Length:119390      Min.   : 1.00            Min.   : 1.0
 Class :character   1st Qu.:16.00            1st Qu.: 8.0
 Mode  :character   Median :28.00            Median :16.0
                    Mean   :27.17            Mean   :15.8
                    3rd Qu.:38.00            3rd Qu.:23.0
                    Max.   :53.00            Max.   :31.0

 stays_in_weekend_nights stays_in_week_nights     adults          children
 Min.   : 0.0000         Min.   : 0.0         Min.   : 0.000   Min.   : 0.0000
 1st Qu.: 0.0000         1st Qu.: 1.0         1st Qu.: 2.000   1st Qu.: 0.0000
 Median : 1.0000         Median : 2.0         Median : 2.000   Median : 0.0000
 Mean   : 0.9276         Mean   : 2.5         Mean   : 1.856   Mean   : 0.1039
 3rd Qu.: 2.0000         3rd Qu.: 3.0         3rd Qu.: 2.000   3rd Qu.: 0.0000
 Max.   :19.0000         Max.   :50.0         Max.   :55.000   Max.   :10.0000
                                                               NA's   :4
     babies              meal             country          market_segment
 Min.   : 0.000000   Length:119390      Length:119390      Length:119390
 1st Qu.: 0.000000   Class :character   Class :character   Class :character
 Median : 0.000000   Mode  :character   Mode  :character   Mode  :character
 Mean   : 0.007949
 3rd Qu.: 0.000000
 Max.   :10.000000

 distribution_channel is_repeated_guest previous_cancellations
 Length:119390        Min.   :0.00000   Min.   : 0.00000
 Class :character     1st Qu.:0.00000   1st Qu.: 0.00000
 Mode  :character     Median :0.00000   Median : 0.00000
                      Mean   :0.03191   Mean   : 0.08712
                      3rd Qu.:0.00000   3rd Qu.: 0.00000
                      Max.   :1.00000   Max.   :26.00000

 previous_bookings_not_canceled reserved_room_type assigned_room_type
 Min.   : 0.0000                Length:119390      Length:119390
 1st Qu.: 0.0000                Class :character   Class :character
 Median : 0.0000                Mode  :character   Mode  :character
 Mean   : 0.1371
 3rd Qu.: 0.0000
 Max.   :72.0000

 booking_changes   deposit_type          agent             company
 Min.   : 0.0000   Length:119390      Length:119390      Length:119390
 1st Qu.: 0.0000   Class :character   Class :character   Class :character
 Median : 0.0000   Mode  :character   Mode  :character   Mode  :character
 Mean   : 0.2211
 3rd Qu.: 0.0000
 Max.   :21.0000

 days_in_waiting_list customer_type           adr
 Min.   :  0.000      Length:119390      Min.   :  -6.38
 1st Qu.:  0.000      Class :character   1st Qu.:  69.29
 Median :  0.000      Mode  :character   Median :  94.58
 Mean   :  2.321                         Mean   : 101.83
 3rd Qu.:  0.000                         3rd Qu.: 126.00
 Max.   :391.000                         Max.   :5400.00

 required_car_parking_spaces total_of_special_requests reservation_status
 Min.   :0.00000             Min.   :0.0000            Length:119390
 1st Qu.:0.00000             1st Qu.:0.0000            Class :character
 Median :0.00000             Median :0.0000            Mode  :character
 Mean   :0.06252             Mean   :0.5714
 3rd Qu.:0.00000             3rd Qu.:1.0000
 Max.   :8.00000             Max.   :5.0000

 reservation_status_date
 Length:119390
 Class :character
 Mode  :character
Count NA Values
Checking the null values from the dataset.
R
# Count NA values in the entire data frame
total_na_count <- sum(is.na(hotel_data))

# Count NA values in each column
na_counts_per_column <- colSums(is.na(hotel_data))

# Display the results
cat("Total NA values in the entire data frame:", total_na_count, "\n")
cat("NA values per column:\n")
print(na_counts_per_column)
Output:
Total NA values in the entire data frame: 4
NA values per column:
                         hotel                    is_canceled
                             0                              0
                     lead_time              arrival_date_year
                             0                              0
            arrival_date_month       arrival_date_week_number
                             0                              0
     arrival_date_day_of_month        stays_in_weekend_nights
                             0                              0
          stays_in_week_nights                         adults
                             0                              0
                      children                         babies
                             4                              0
                          meal                        country
                             0                              0
                market_segment           distribution_channel
                             0                              0
             is_repeated_guest         previous_cancellations
                             0                              0
previous_bookings_not_canceled             reserved_room_type
                             0                              0
            assigned_room_type                booking_changes
                             0                              0
                  deposit_type                          agent
                             0                              0
                       company           days_in_waiting_list
                             0                              0
                 customer_type                            adr
                             0                              0
   required_car_parking_spaces      total_of_special_requests
                             0                              0
            reservation_status        reservation_status_date
                             0                              0
Removing NA Values
If any null values is present it will be removed by this command.
R
# Removing for null values
hotel_data <- na.omit(hotel_data)

sum(is.na(hotel_data))
Output:
[1] 0
Visualization
Barplot
The barplot shows the both type hotel reservations number .
R
ggplot(hotel_data, aes(x = reservation_status, fill = hotel)) +
  geom_bar(position = "dodge") +
  labs(title = "Reservation Status by Hotel Type", x = "Reservation Status",
       y = "Count")
Output:

Analyzing Hotel Booking Patterns in R
Scatterplot between Lead Time vs. Average Daily Rate
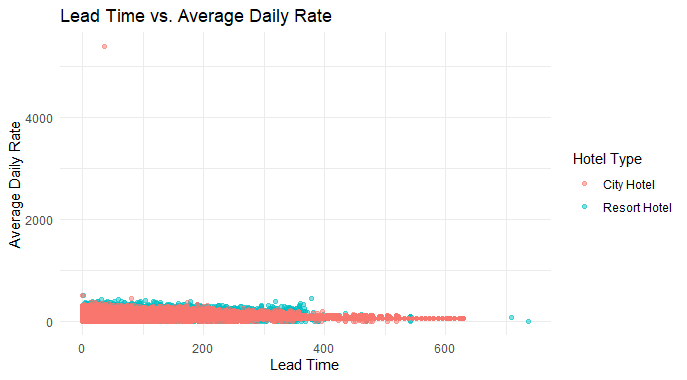
This scatterplot aims to understand the relationship between lead time (the number of days between booking and arrival) and the Average Daily Rate (ADR). The points on the scatterplot represent individual bookings.
R
# Visualization: Scatter Plot - Lead Time vs. Average Daily Rate
ggplot(hotel_data, aes(x = lead_time, y = adr, color = hotel)) +
  geom_point(alpha = 0.5) +
  labs(title = "Lead Time vs. Average Daily Rate",
       x = "Lead Time",
       y = "Average Daily Rate",
       color = "Hotel Type") +
  theme_minimal()
Output:
Analyzing Hotel Booking Patterns in R
A positive correlation between lead time and ADR suggests that longer lead times may be associated with lower ADR.
- Clusters or patterns in the scatterplot may indicate seasonality or specific booking trends.
Histogram with Distplot for Hotel Booking Pattern in R
We take sample portion of this large dataset , it can be modified according to the demand.
R
# Sample a subset of the dataset (adjust the number as needed)
sample_size <- 1000
hotel_data_sample <- hotel_data %>% sample_n(sample_size)

# Set a theme for better appearance
theme_set(theme_minimal())

# Create a histogram with distribution plot for lead time
ggplot(hotel_data_sample, aes(x = lead_time)) +
  geom_histogram(aes(y = ..density..), binwidth = 10, fill = "red", color = "green",
                 alpha = 0.7) +
  geom_density(color = "blue") +

  labs(title = "Hotel Booking Lead Time Distribution with Distribution Plot",
       x = "Lead Time (days)",
       y = "Density") +

  theme(panel.grid.major = element_line(color = "gray", linetype = "dashed",size = 0.2),
        panel.grid.minor = element_blank(),
        panel.background = element_rect(fill = "white"),
        legend.position = "none") +

  scale_x_continuous(breaks = seq(0, max(hotel_data_sample$lead_time), by = 20))
Output:

Analyzing Hotel Booking Patterns in R
Skewed distributions may indicate certain booking behaviors, such as last-minute bookings or extended stays.
- Peaks and valleys in the distplot offer insights into preferred booking patterns within the dataset.
Outliers Detection forHotel Booking Pattern Data in R
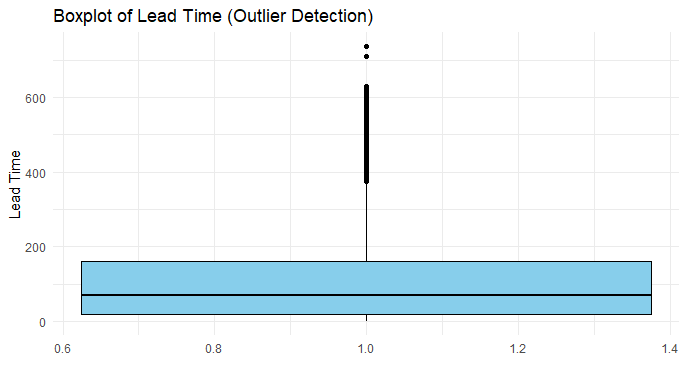
Outliers can significantly impact analysis. This step involves identifying and examining potential outliers in numeric columns like lead time, ADR, or stays.
R
# Assuming 'lead_time' is the column of interest
# Create a boxplot to visualize outliers
ggplot(hotel_data, aes(x = 1, y = lead_time)) +
  geom_boxplot(fill = "skyblue", color = "black") +
  labs(title = "Boxplot of Lead Time (Outlier Detection)",
       x = "",
       y = "Lead Time") +
  theme_minimal()
Output:
Analyzing Hotel Booking Patterns in R
Outliers may highlight exceptional cases, such as extremely long lead times or unusually high ADRs.
- Understanding outliers helps in assessing the robustness of general trends and patterns in the dataset.
Check Monthly Booking Trends
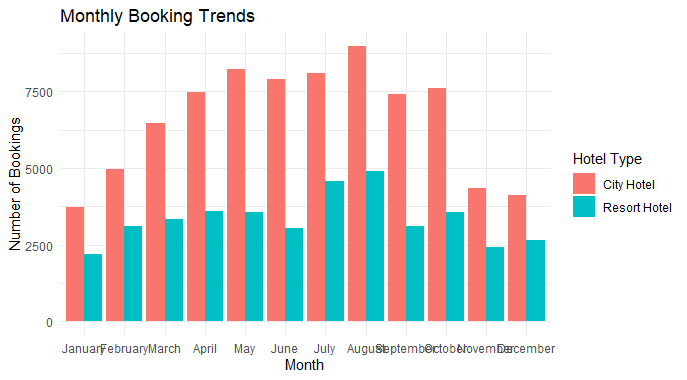
Analyzing booking trends on a monthly basis helps identify seasonality and understand when hotels experience peak or off-peak periods.
R
# Visualization Monthly Booking Trends
hotel_data %>%
  mutate(arrival_date_month = factor(arrival_date_month, levels = month.name)) %>%
  ggplot(aes(x = arrival_date_month, fill = hotel)) +
  geom_bar(position = "dodge", stat = "count") +
  labs(title = "Monthly Booking Trends",
       x = "Month",
       y = "Number of Bookings",
       fill = "Hotel Type") +
  theme_minimal()
Output:
Analyzing Hotel Booking Patterns in R
Peaks in certain months may be attributed to holidays, events, or specific seasons, influencing booking patterns.
- Understanding monthly trends aids in optimizing resource allocation and marketing strategies.
Check the Average Daily Rate Distribution
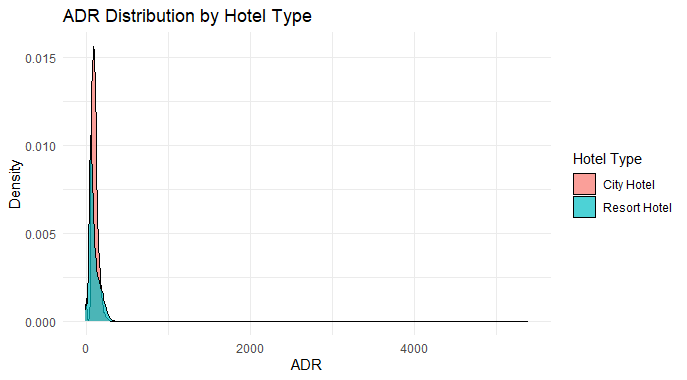
Examining the distribution of Average Daily Rates provides insights into the pricing strategy of hotels.
R
# Visualization Average Daily Rate (ADR) Distribution
ggplot(hotel_data, aes(x = adr, fill = hotel)) +
  geom_density(alpha = 0.7) +
  labs(title = "ADR Distribution by Hotel Type",
       x = "ADR",
       y = "Density",
       fill = "Hotel Type") +
  theme_minimal()
Output:
Analyzing Hotel Booking Patterns in R
Peaks or clusters in the ADR distribution may indicate different pricing tiers or packages.
- Understanding ADR distribution helps in setting competitive and profitable pricing strategies.
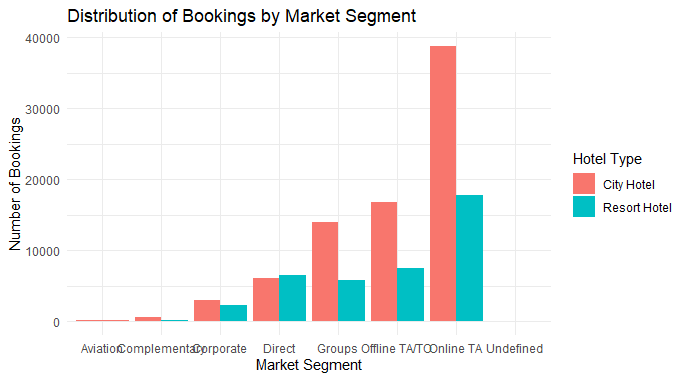
Check Market Segment Distribution
Analyzing the distribution of market segments provides insights into the customer base and booking sources.
R
# Visualization  Market Segment Distribution
hotel_data %>%
  ggplot(aes(x = market_segment, fill = hotel)) +
  geom_bar(position = "dodge", stat = "count") +
  labs(title = "Distribution of Bookings by Market Segment",
       x = "Market Segment",
       y = "Number of Bookings",
       fill = "Hotel Type") +
  theme_minimal()
Output:
Analyzing Hotel Booking Patterns in R
Dominant market segments indicate the primary sources of bookings, influencing marketing and communication strategies.
- Varied market segment distribution helps in understanding the diverse customer base.
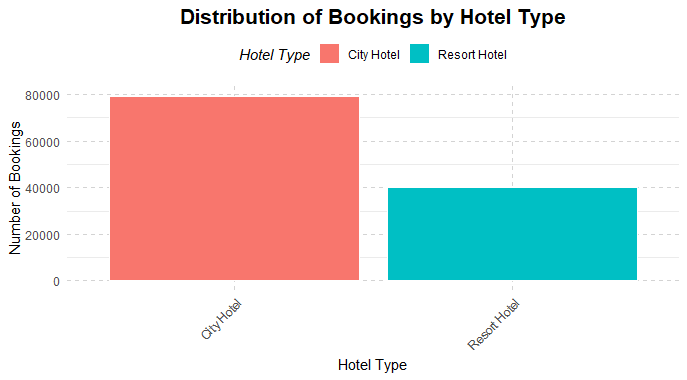
Check Most Preffered hotel
Identifying the most preferred hotel provides insights into customer preferences and popularity.
R
# Visualization: Most Preferred Hotel
library(ggplot2)
library(ggthemes)  # For additional themes

# Assuming hotel_data is your data frame
hotel_data %>%
  ggplot(aes(x = hotel, fill = hotel)) +
  geom_bar(stat = "count", color = "white", size = 0.7) +
  labs(title = "Distribution of Bookings by Hotel Type",
       x = "Hotel Type",
       y = "Number of Bookings",
       fill = "Hotel Type") +
  theme_minimal() +
  theme(axis.text.x = element_text(angle = 45, hjust = 1),
        plot.title = element_text(size = 16, hjust = 0.5, face = "bold"),
        legend.title = element_text(face = "italic"),  # Make legend title italic
        legend.position = "top",  # Position legend at the top
        panel.grid.major = element_line(colour = "lightgray", linetype = "dashed"))
Output:
Analyzing Hotel Booking Patterns in R
The preferred city hotel may have unique features or services that attract more bookings.
- Understanding customer preferences aids in targeted marketing and service improvements.
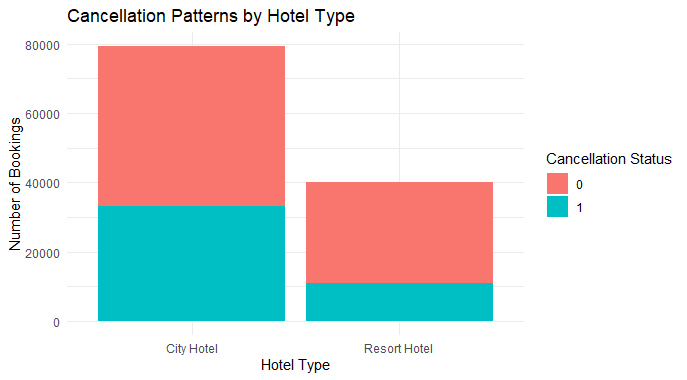
Visualize Cancellation Patterns
Visualizing cancellation patterns helps in understanding factors influencing cancellations and optimizing reservation management.
R
# Visualization: Cancellation Patterns
hotel_data %>%
  ggplot(aes(x = hotel, fill = as.factor(is_canceled))) +
  geom_bar(stat = "count", position = "stack") +
  labs(title = "Cancellation Patterns by Hotel Type",
       x = "Hotel Type",
       y = "Number of Bookings",
       fill = "Cancellation Status") +
  theme_minimal()
Output:
Analyzing Hotel Booking Patterns in R
Peaks in cancellation rates may be linked to specific seasons, events, or external factors.
- Identifying patterns in cancellations assists in implementing strategies to reduce cancellations.
Analyzing Booking Distribution by Month
Examining the booking distribution by month provides insights into booking patterns over the entire dataset.
R
# Visualization: Booking Distribution by Month
hotel_data %>%
  ggplot(aes(x = arrival_date_month, fill = hotel)) +
  geom_bar(stat = "count", position = "stack") +
  labs(title = "Booking Distribution by Month",
       x = "Month",
       y = "Number of Bookings",
       fill = "Hotel Type") +
  theme_minimal() +
  scale_x_discrete(labels = function(x) formatC(as.numeric(x), width = 2, flag = "0"))
Output:

Analyzing Hotel Booking Patterns in R
Seasonal variations may be observed, influencing marketing and pricing strategies.
- Identifying booking patterns helps in resource planning and optimizing hotel operations.
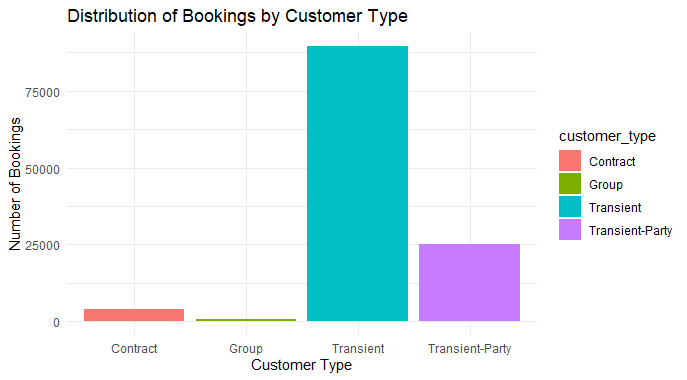
Check the Customer type
Analyze the distribution of bookings based on customer types (Transient, Contract, Group, etc.).
R
# Create a barplot for customer type distribution
ggplot(hotel_data, aes(x = customer_type, fill = customer_type)) +
  geom_bar() +
  labs(title = "Distribution of Bookings by Customer Type",
       x = "Customer Type",
       y = "Number of Bookings") +
  theme_minimal()
Output:
Analyzing Hotel Booking Patterns in R
The barplot visualizes the proportion of bookings attributed to different customer types, such as Transient, Contract, Group, etc.
- It helps identify which customer segments contribute significantly to the overall bookings, allowing for targeted marketing efforts or tailored services.
- Understanding the preferred customer types can guide strategies to attract and retain specific segments, enhancing customer satisfaction and loyalty.
Checking the Booking Channels
This barplot illustrates the distribution of bookings through different channels, providing insights into the popularity of channels such as direct bookings, online travel agencies (OTA), and corporate bookings.
R
# Create a barplot for booking distribution by channels
ggplot(hotel_data, aes(x = distribution_channel, fill = distribution_channel)) +
  geom_bar() +
  labs(title = "Distribution of Bookings by Booking Channels",
       x = "Booking Channels",
       y = "Number of Bookings") +
  theme_minimal()
Output:
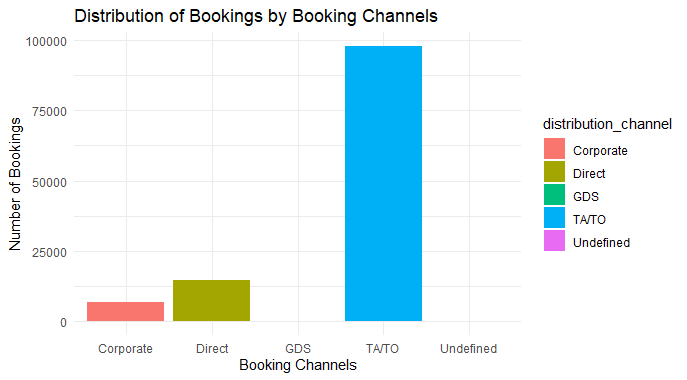
Analyzing Hotel Booking Patterns in R
The visualization shows the distribution of bookings across various channels such as Direct, Online Travel Agencies (OTA), and Corporate.
- From the barplot, it appears that the “TA/TO” (Travel Agents/Tour Operators) channel has the highest number of bookings compared to other channels.
- The hotel management may infer that the TA/TO channel is crucial for bookings, and they might consider strengthening marketing efforts or partnerships with travel agencies to further enhance this channel.
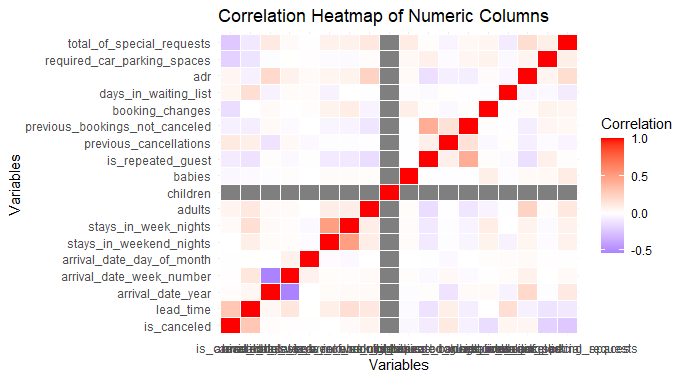
Correlation Heatmap of Numeric Columns
The correlation heatmap illustrates the relationships between numeric variables, revealing potential dependencies.
R
# Load the reshape2 package
library(reshape2)
# Select numeric columns for correlation heatmap
numeric_columns <- select_if(hotel_data, is.numeric)

# Calculate the correlation matrix
correlation_matrix <- cor(numeric_columns)

# Plot the heatmap
ggplot(data = melt(correlation_matrix), aes(x = Var1, y = Var2, fill = value)) +
  geom_tile(color = "white") +
  scale_fill_gradient2(low = "blue", mid = "white", high = "red", midpoint = 0) +
  theme_minimal() +
  labs(title = "Correlation Heatmap of Numeric Columns",
       x = "Variables",
       y = "Variables",
       fill = "Correlation")
Output:
Analyzing Hotel Booking Patterns in R
Strong correlations may indicate interdependencies between variables, influencing decision-making.
- Understanding correlations helps in identifying key factors affecting booking patterns.
Analyze the Weekday Vs Weekend bookings
Visualize the distribution of bookings between weekdays and weekends.
R
# Create a barplot for weekday vs. weekend bookings
hotel_data %>%
  mutate(booking_day_type = ifelse(stays_in_weekend_nights >0,"Weekend","Weekday"))%>%
  ggplot(aes(x = booking_day_type, fill = booking_day_type)) +
  geom_bar() +
  labs(title = "Distribution of Bookings between Weekdays and Weekends",
       x = "Day Type",
       y = "Number of Bookings") +
  theme_minimal()
Output:
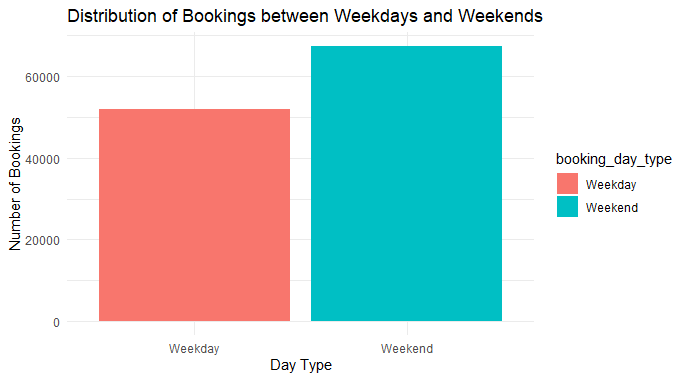
Analyzing Hotel Booking Patterns in R
The number of bookings during weekdays is notably lower than weekends, indicating a higher preference for weekends stays.
Conclusion
This R analysis explores hotel booking patterns, covering data loading, structure check, and visualization. Various plots reveal trends, distributions, customer type , booking source and correlations, offering insights into customer behavior. The most preferred hotel and cancellation patterns are highlighted. Overall, the analysis provides valuable information for understanding and decision-making in the hospitality industry.
Share your thoughts in the comments
Please Login to comment...