Histogram of an Image
Last Updated :
08 Feb, 2022
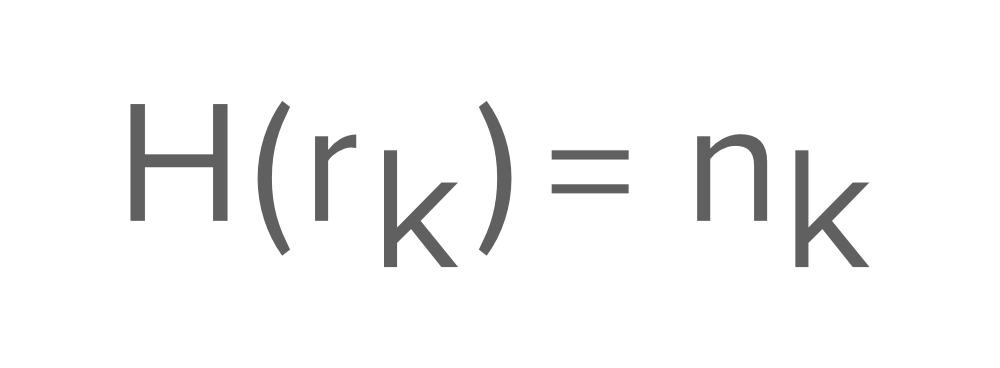
The histogram of a digital image with gray levels in the range [0, L-1] is a discrete function.
Histogram Function:
Points about Histogram:
- Histogram of an image provides a global description of the appearance of an image.
- Information obtained from histogram is very large in quality.
- Histogram of an image represents the relative frequency of occurrence of various gray levels in an image.
Let’s assume that an Image matrix is given as:
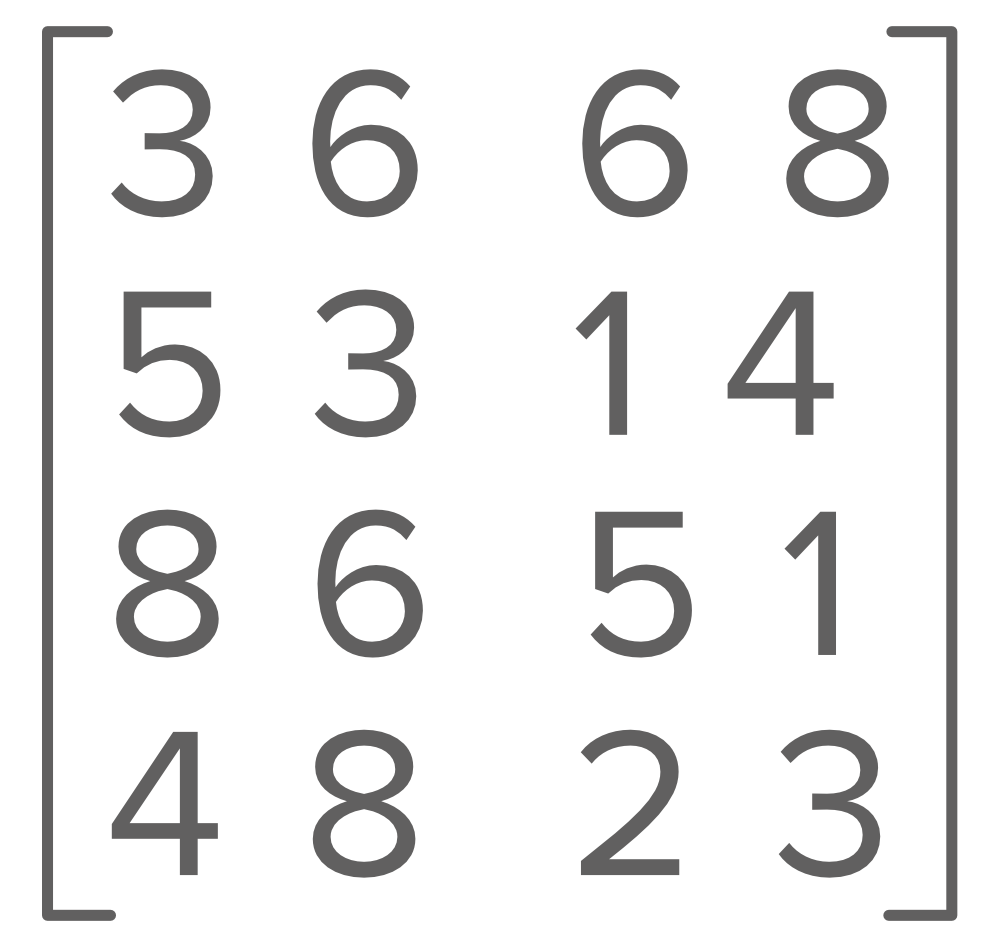
This image matrix contains the pixel values at (i, j) position in the given x-y plane which is the 2D image with gray levels.
There are two ways to plot a Histogram of an image:
Method 1: In this method, the x-axis has grey levels/ Intensity values and the y-axis has the number of pixels in each grey level. The Histogram value representation of the above image is:
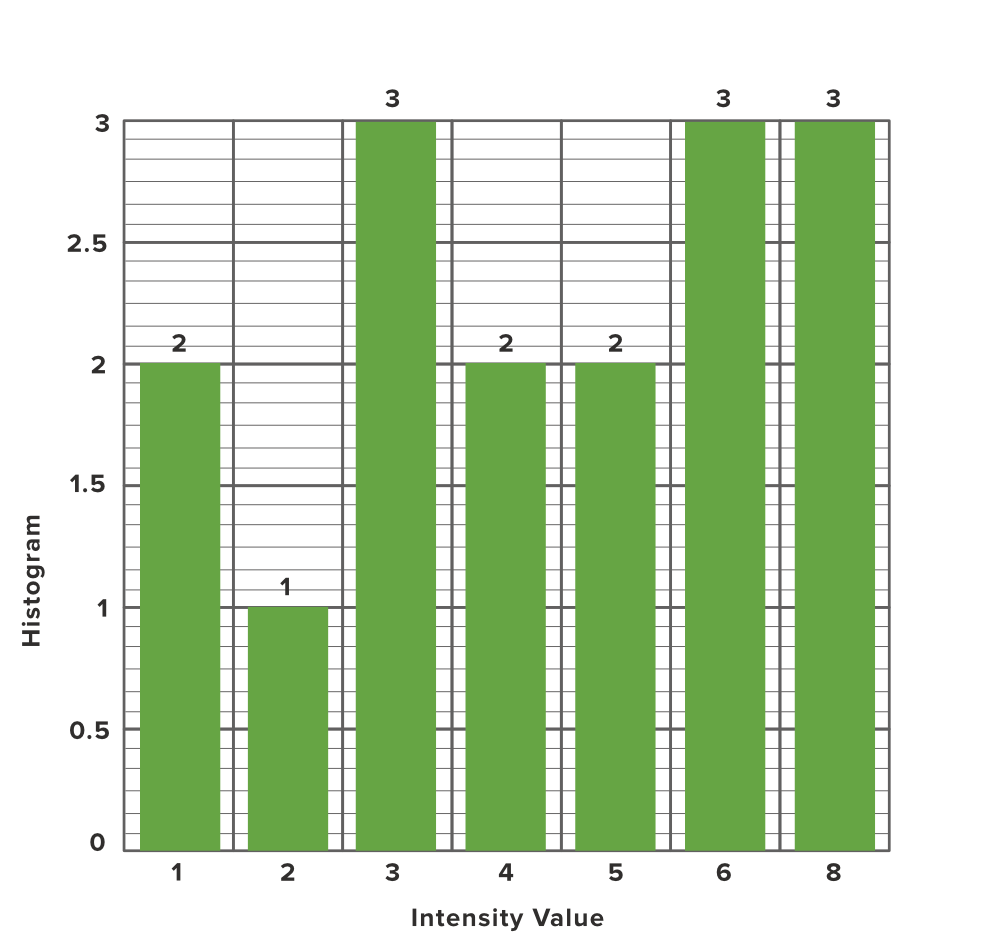
Explanation: The above image has 1, 2, 3, 4, 5, 6, and 8 as the intensity values and the occurrence of each intensity value in the image matrix is 2, 1, 3, 2, 2, 3 and 3 respectively so according to intensity value and occurrence of that particular intensity we mapped them into a Graph.
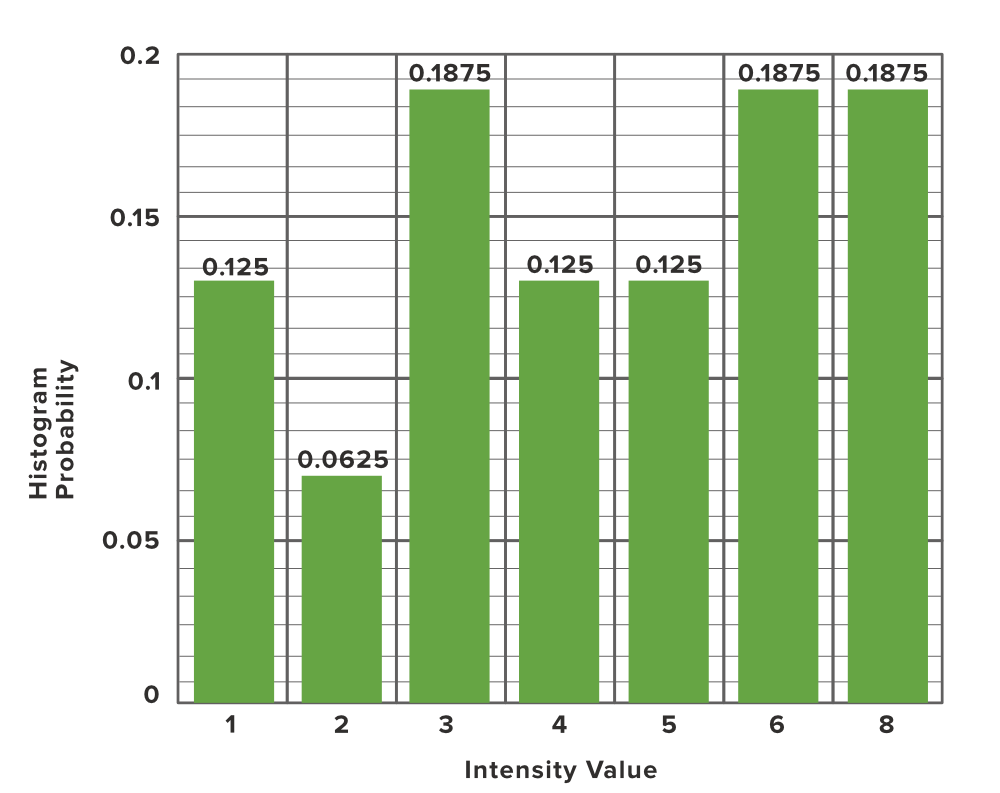
Method 2: In this method, the x-axis represents the grey level, while the y-axis represents the probability of occurrence of that grey level.
Probability Function:
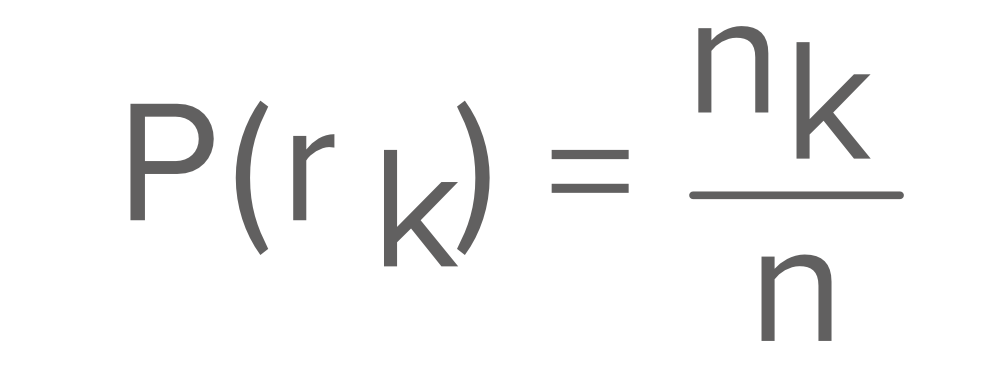
Below table shows the probability of each intensity level of an pixel
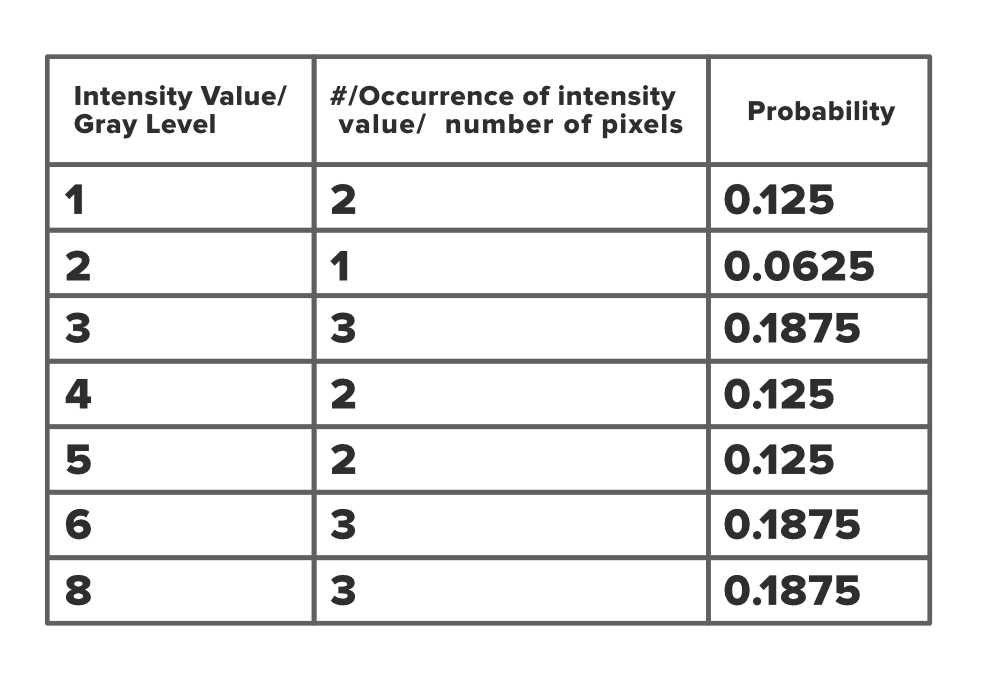
Now we can create a histogram graph for each pixel and corresponding occurrence probability.
Share your thoughts in the comments
Please Login to comment...