Get a List of points obtained by Interpolation in R Programming – spline() and splinefun() Function
Last Updated :
03 Jul, 2020
In R programming, spline() and splinefun() function is used to create a list of points obtained by interpolation. It performs cubic spline interpolation of given data points.
Syntax:
spline(x, y, method)
and
splinefun(x, y, method)
Parameters:
x, y: represents vectors giving the points for interpolation
method: represents the type of spline interpolation to be used
To know about more optional parameters of both the functions, use below command in console:
help("spline")
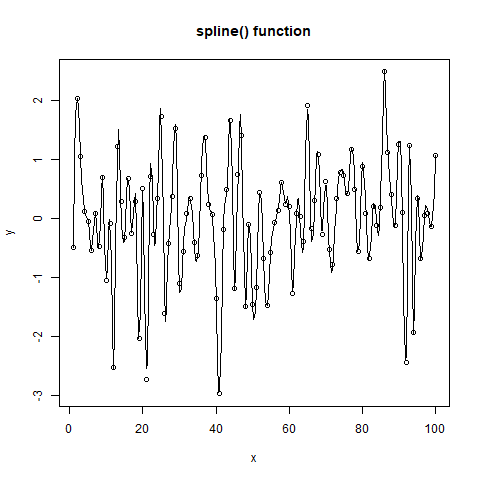
Example 1:
n <- 100
x <- 1:n
y <- rnorm(n)
png(file = "splineGFG.png")
plot(x, y, main = "spline() function")
lines(spline(x, y))
dev.off()
|
Output:
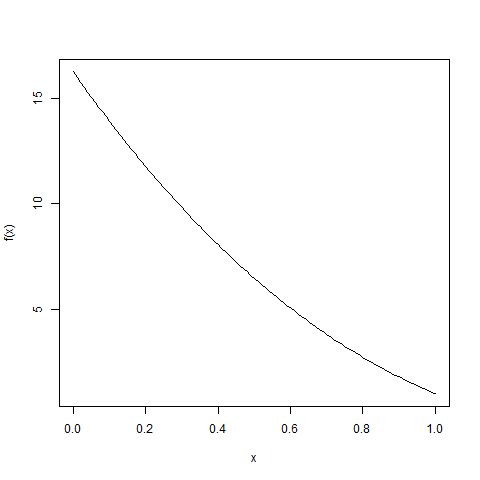
Example 2:
n <- 100
x <- 1:n
y <- sin((x-0.5)*pi)
png(file = "splinefunGFG.png")
f <- splinefun(x, y)
curve(f(x))
dev.off()
|
Output:
Share your thoughts in the comments
Please Login to comment...