Finding System Boot-up Performance Statistics in Linux Using systemd-analyze Command
Last Updated :
12 Mar, 2021
If your Linux system is taking so much time to boot, and you want to know which process is taking so much time to boot then you are on the right page. We are going to see how to get a complete overview of system boot-up time and which service is taking more time to initialize.
We are going to use the systemd-analyze command and subcommands of systemd-analyze to view the statistics and retrieve other states and tracing information from the system and service manager. To see information like time taken by the kernel and userspace while booting use the simple systemd-analyze command.
systemd-analyze

To view the list of all running services sorted in order of time taken to initialize by respective process use the blame sub command. After running the process use [ENTER] key to view more services and use q to quit.
systemd-analyze blame
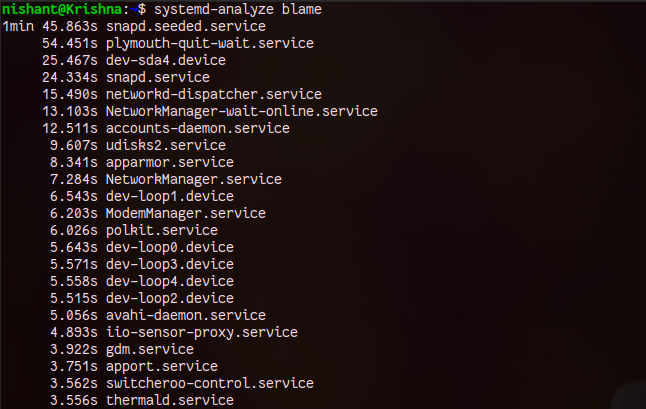
We can see in the above output to all services are sorted in the time taken to initialize in decreasing order. And we also see which process is taking the maximum time.
To view the list of services or units with the time taken to initialize in a tree-like structure We are going to use the critical-chain sub-command.
systemd-analyze critical-chain

Now let’s see about one more sub-command of systemd-analyze which allows us to produce the graphical (SVG format) with details like initialization time taken by the service to start.
Make sure you have installed the gpicview on the Linux system. You can install it simply by the following the command:
sudo apt install gpicview

The use of the plot subcommand of systemd-analyze command
systemd-analyze plot > boot_stat.svg
gpicview boot_stat.svg

You can zoom the output using the ctrl and + key.
To view the information from a remote host over ssh use the -H flag and specify the username@host. Here is example:
systemd-analyze time -H gfg@192.168.1.110
systemd-analyze blame -H gfg@192.168.56.165
systemd-analyze critical-chain -H gfg@192.168.1.178
To know more about the systemd-analyze see the man page of systemd-analyze using the following command.
man systemd-analyze

Share your thoughts in the comments
Please Login to comment...