Monitoring the performance and health of a Linux system is essential for maintaining its stability and optimizing resource utilization. Linux provides a variety of commands and tools to facilitate system monitoring, enabling administrators to track key metrics, identify potential issues, and ensure efficient operation. Linux offers a robust set of utilities that empower administrators to assess and manage the performance of their systems effectively. In this dynamic environment, understanding and utilizing these monitoring commands and tools are crucial for proactive system management and troubleshooting.
Linux System Monitoring Commands & Tools
1. top command
The top command is super useful for monitoring what processes are using the most CPU and memory on your Linux system. It gives you a dynamic real-time view that updates frequently to show any changes. To use it simply open a terminal type “top” and hit enter. You then see a table with different columns like CPU and MEM usage percentages, process IDs, user accounts running each process, and the actual command names.
Command:
top
This command continuously updates a screen, displaying various system metrics. Processes are sorted by default based on CPU usage in descending order, presenting the most resource-intensive processes at the top for quick monitoring and identification.

System Activity and Running Process & Their Up-time
2. vmstat command
The vmstat command helps monitor your Linux system’s memory and CPU usage over time. It gives you snapshots of important statistics like memory, swap, IO, and CPU activity.
Command:
vmstat
As it runs you can see if any resources become constrained over time or if abnormal changes are indicating a potential issue. Generally higher IO wait means disk bottlenecks while a higher system/user CPU could mean an intensive application process.

Checking System Activity using vmstat Command
3. free command
The free command in Linux is used to display information about the system’s memory usage. When you run the free command without any options, it provides details about the total, used, and free physical and swap memory on your system.
Command:
free

System’s available Space and Cache Using free Command
4. iostat command
The iostat command reports statistics about disk input and output operations and CPU utilization on Linux systems. It’s useful for monitoring disk performance and throughput. This will help identify high disk utilization. Generally below 60% CPU idle time means potential cpu CPU-constrained disk throughput. And increasingBusy% or long ServiceTime may indicate a struggling drive.
Command:
iostat

Disk Performance and Activity using iostat Command
5. netstat command
The netstat command is super handy for monitoring network connections and activity on your Linux machine. You can use it to see open ports, established connections, listening services, packet statistics, and more. This helps you understand what’s happening on your network.
Command:
netstat
This will display a table of network connections, protocols, connection states, processes using each connection, and more.
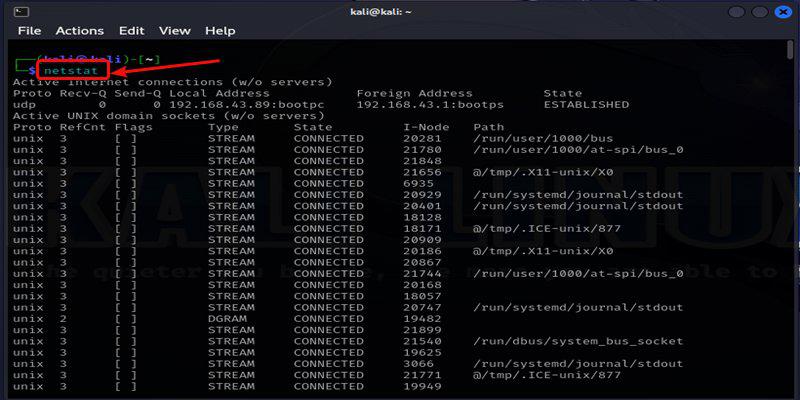
Network Connections, Open Ports, Packets & Protocols using netstat Command
6. iotop command
The iotop command is great for monitoring disk I/O usage on a Linux system. It shows a live view of the processes doing the heaviest disk read and write operations at any given moment.
Command:
sudo iotop
It will display columns with the I/O bandwidth used by each process, similar to how the top shows CPU usage. It also calculates totals and percentages of disk activity. The main goal is to identify processes that may be slowing your system down from disk I/O overloading. Higher batch counts on the right often relate to heavier disk usage.

Display columns with the I/O bandwidth used by Each System Process
7. htop command
The htop command is a handy interactive process viewer that’s like an upgraded top version. You see a real-time table of running processes with their CPU and memory usage, similar to the top.
- Color coding so you can easily spot high-usage processes.
- Ability to scroll vertically and horizontally to see full commands, environment variables, etc.
- Tree view to see parent-child process relationships.
- Easier process sorting and priority config.
- Send signals like pause, and kill directly in the interface.
Command:
sudo htop
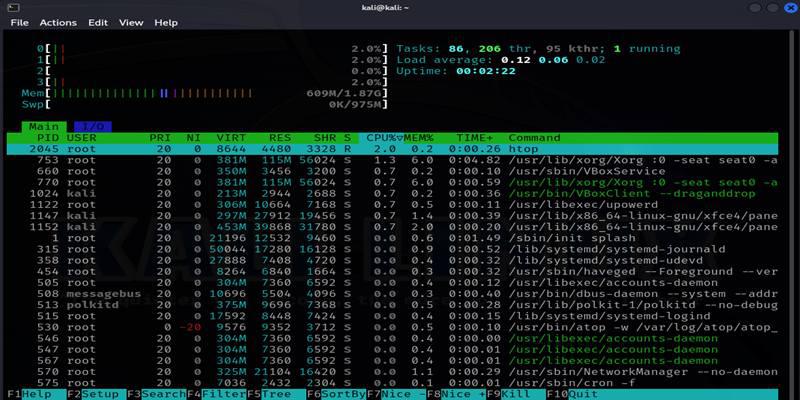
Running processes with their CPU and memory usage
8. atop command
The atop tool is useful for monitoring overall Linux system performance over time. It shows historical usage and trends for CPU, memory, disk I/O, network, and processes.
- Charts showing usage graphs over defined periods.
- Ability to sort/filter data with commands.
- Inspection of exact moments of peak usage.
- Sends warnings about abnormal resource usage.
Command:
atop
This can help to solve system-level data with application logs when troubleshooting issues.
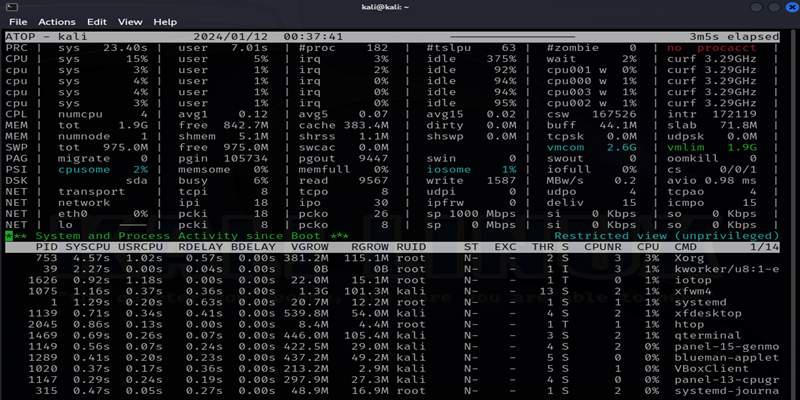
Linux system performance and CPU, memory, disk I/O, network, and processes
9. nmon command
The nmon command stands for Nigel’s performance Monitor. It’s a handy tool for graphing and monitoring live system statistics like CPU, memory, disks, network, processes, and temperatures.
Command:
nmon
This will bring up an interactive interface showing graphs and measurements updating in real-time on the terminal. It logs everything for later analysis.
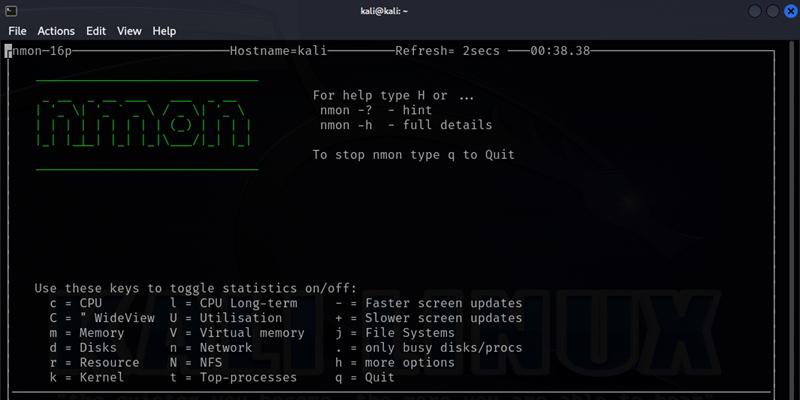
Nmon Tool Interface
Use these keys to get the results you want from the Table:
- C: Shows CPU statistics and charts.
- N: Shows network statistics and charts.
- D: Shows disk statistics and charts.
- M: Shows memory statistics and charts.
- P: Shows detailed process statistics and charts.
- T: Shows temperature/sensor readings.
- /: Zooms graphs out/in on the time axis.
- R: Provides resource monitoring advice.
- s: Saves logs to CSV files for later analysis.
- c: Configuration menu to customize stats intervals, durations, etc.
- q: Quits and exits nmon.
10. iftop command
The iftop command is super useful for monitoring network usage and bandwidth in real-time. It displays a table of the connections and traffic going through your network interfaces much like the top displays process activity. iftop makes it easy to identify bandwidth-hungry applications, unusual traffic spikes indicating issues, and general network usage patterns.
Command:
sudo iftop
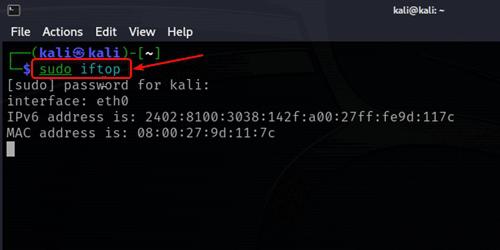
Connected Devices on our Network with their IP addresses.
This will automatically detect interfaces and start monitoring live traffic through them. It shows:
- Instantaneous bandwidth rates.
- Total data transferred.
- Host IPs are sending/receiving the most data.
- Network connection peer hosts.
- You can also filter by IPs/protocols or limit monitoring to specific interfaces.
Conclusion
In conclusion, monitoring the performance and health of a Linux system is essential for effective system management. The highlighted Linux monitoring commands and tools provide valuable insights into various aspects such as CPU, memory, disk I/O, network, and processes. From dynamic real-time views with commands like top and htop to historical data analysis using tools like atop and nmon, these utilities offer diverse perspectives for proactive troubleshooting and resource optimization. Utilizing these tools empowers administrators to maintain system stability, identify potential issues, and ensure the efficient operation of Linux environments.
Share your thoughts in the comments
Please Login to comment...