TCP flow Analyze and Debug Network Traffic in Linux
Last Updated :
04 Dec, 2022
TCPflow is a completely free and open-source tool used for the analysis of network traffic on Linux and Unix systems. The data which is transferred during the connection is stored in a file by TCPflow in a systematic format for later study. TCPflow is almost the same as its counterparts such as Wireshark and Tcpdump, but the main difference is the ability of TCPflow to reconstruct thousands of packets at a single time. This saves a lot of time and helps in the quick analysis of data. TCPflow was developed by Jeremy Elson in 1998 but the maintenance was stopped in 2003. Simson Garfinkel Took over the maintenance in 2006 and added some new features such as:
- Support for IPv6 and VLANs.
- Added C++ STL for fast operations.
- Added support for continuous operations.
- Created a plug-in architecture.
TCPflow has a variety of features that make it one of the best network analyzers in the market. Some of the features are discussed below.
Features of TCPflow:
- Completely free, open-source, and a very powerful network traffic analyzer.
- Supports powerful filtering expressions.
- Puts each flow in a systematic order and organizes them in a separate file.
- Helpful in performing network forensics and is used to divulge HTTP sessions.
- Capable of invoking third-party programs for enhanced processing.
- Contains an advanced plugin system, for the decompression of HTTP connections.
- Capable of undoing the MIME coding.
- Due to the proper storage of connections, debugging is also easy.
The Linux OS we will be using in this article will be Ubuntu, you can use any Distro of your choice.
Steps to get started with TCPflow
Step 1: Downloading and install TCPflow
Download TCPflow from the official repository using the below command:
sudo apt install tcpflow
Step 2: Running TCPflow
After installing TCPflow use the command below to run it, TCPflow listens over the active network interface.
sudo tcpflow
Step 3: Listing the files and analyze them using TCPflow
The default format in which TCPflow stores the captured data files is:
<ip_of_source>.<source_port>-<ip_of_destination>.<destination_port>
Let us list all the files and see the results and the TCP transcript files generated:
ls -l
The TCP output can be seen clearly if we take the first file in the list which is 010.000.002.015.35576-018.066.030.094.00443, this means that the first file has the data which was transferred from the remote host (18.66.30.94) via port 443 to the Localhost on which TCPflow was active (10.0.2.15) via the port 35576.
Along with the above files, a separate XML file is also generated which keeps information regarding the compilation of the program, the host it was run on, and all the TCP connections.
Step 4: Finding the location of the transcript files:
TCPflow by default stores the transcript files in the present working directory. With the help of the -o
the flag we can specify the location where these files will be written, using the below command:
sudo  tcpflow  -o  tcpflow_files
sudo  ls  -l  tcpflow_files
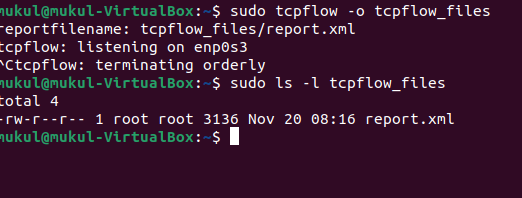
The XML file can also be seen clearly.
Step 5: Printing the Contents of Packets and capturing traffic
With the help of the below command, the user can print the content of packets on the screen. When this command is used no additional data is captured. The -c flag will be used:
sudo tcpflow -c
For Capturing the traffic on a specific port (ex. 22) use the below command:
sudo tcpflow port 22
Step 6: Capturing packets from a specific interface and host
The -i flag can be used to capture packets from a specific network interface:
sudo tcpflow -i enp0s3 port 80
A specific target host can also be specified and used. The values that can be considered for the target are Ip address, hostname, and domains.
sudo tcpflow -c host 10.0.2.15
or
sudo tcpflow -c host www.facebook.com
Step 7: Using the -a or -e flags
The functions of -e and -a flags are similar, with their help the user can enable processing using all the scanners.
 sudo tcpflow -a
OR
 sudo tcpflow -e all
Specific scanners can also be activated, use the below command for individual scanners:
sudo tcpflow -e http
If we want to disable a particular scanner then we will have to use the -x flag.
sudo tcpflow -a -x http
Now all the scanners except HTTP are enabled.
Step 8: Enabling the verbose mode
To enable the verbose mode use the below command:
sudo tcpflow -v
OR
sudo tcpflow -d 10
Step 9: Prevention of TCPflow to enter the promiscuous mode:
By default, TCPflow tries to put the network interface into a promiscuous mode (Without careful judgment or care), this can be prevented by using the -p flag:
sudo tcpflow -p -i enp0s3
More information about TCPflow can be found on the TCPflow’s man page.
man tcpflow
Conclusion
In this article, we saw various functions and uses of this very important and powerful tool. Each and every tool has its pros and its cons. TCPflow also has a minor flaw, in that it does not properly understand IP fragments, thus the data transmitted which contains IP fragments might not be captured. This limitation might be removed in the future. Apart from the above limitation, TCPflow is a very powerful tool that can help you out in carrying out network forensics and can give you a better understanding of network packets. Make sure to check this tool and learn something new.
Share your thoughts in the comments
Please Login to comment...