Debugging JavaScript in Microsoft Edge Browser
Last Updated :
29 Sep, 2023
While working with JavaScript, we often encounter several errors but finding them out is truly an arduous task. So, in this article, we will learn how to debug JavaScript in Microsoft Edge.
Steps to debug the JavaScript in Microsoft Edge
- Finding the bug
- Being familiar with sources tool UI
- Use a breakpoint to pause the code
- Setting a line-of-code breakpoint
- Check variable values
- Fix the code
Step 1: Finding the bug
To start with debugging, we need to perform some actions to reproduce a bug. For demonstration purposes, here We have the code to add two numbers.
Javascript
function onClick() {
if (inputsAreEmpty()) {
label.textContent = "Error: one or both inputs are empty.";
return;
}
updateLabel();
}
function inputsAreEmpty() {
if (getNumber1() === "" || getNumber2() === "") {
return true;
} else {
return false;
}
}
function updateLabel() {
var addend1 = getNumber1();
var addend2 = getNumber2();
var sum = addend1 + addend2;
label.textContent = addend1 + " + " + addend2 + " = " + sum;
}
function getNumber1() {
return inputs[0].value;
}
function getNumber2() {
return inputs[1].value;
}
var inputs = document.querySelectorAll("input");
var label = document.querySelector("p");
var button = document.querySelector("button");
button.addEventListener("click", onClick);
|
HTML
<html>
<head>
<title>Demo: Debugging JavaScript with Microsoft Edge DevTools</title>
<meta name="viewport" content="width=device-width, initial-scale=1">
<style>
h1 {
font-size: 1.5em
}
input, button {
min-width: 72px;
min-height: 36px;
border: 1px solid grey;
}
label, input, button {
display: block;
}
input {
margin-bottom: 1em;
}
</style>
</head>
<body data-new-gr-c-s-check-loaded="14.1039.0" data-gr-ext-installed="">
<h1>Debugging JavaScript with Microsoft Edge</h1>
<label for="num1">Enter the first number</label>
<input placeholder="Number 1" id="num1">
<label for="num2">Enter the second number</label>
<input placeholder="Number 2" id="num2">
<button>Add</button>
<p></p>
<script src="get-started.js"></script>
</body>
</html>
|
Output:
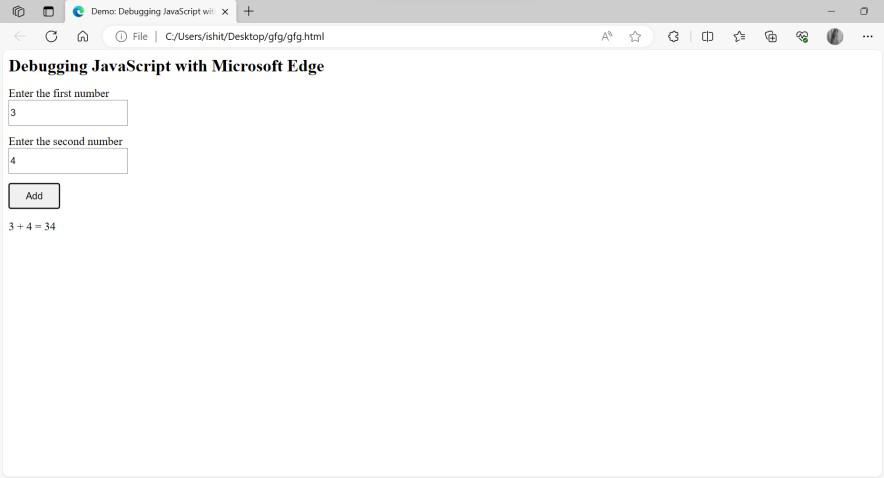
Output
Now, it is not giving the correct result in the output as you can see, so we will check what is the error. Moving on to the next step, we will try to get familiar with the sources tool UI
Step 2: Being familiar with sources tool UI
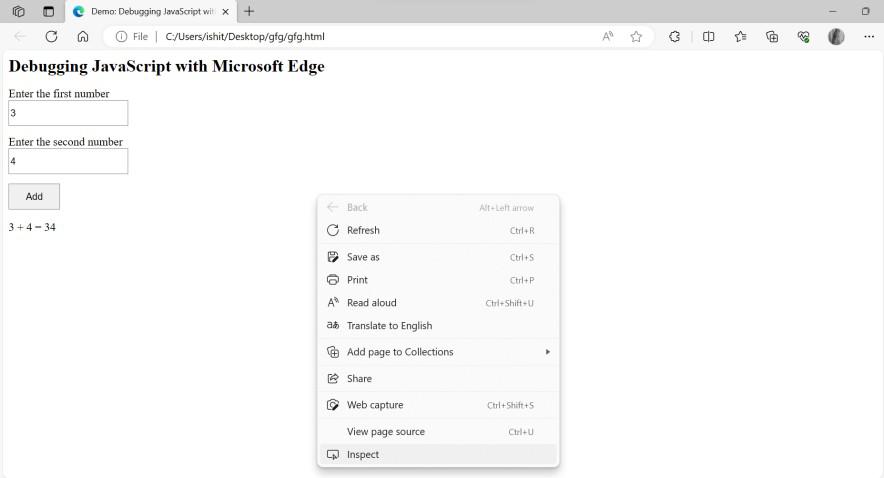
Microsoft edge provides us with different developer tools to perform different tasks. To open Developer tools, right click anywhere on the webpage and click on “Inspect”
Select the “Sources” tool. It comprises of three parts:-
- The pane in the upper left corner is called the Navigator tab. It lists down all the files that a webpage has requested. It is also called the page tab.
- Once you have selected the file from the navigator pane, all the contents of it appear on the right hand side pane, this tab is called the Editor tab.
- The bottom tab which provides a wide variety of tools for debugging the code is called the Debugger tab.
To debug the code, from the navigator tab, select your JavaScript file. Here, We will select get-started.js File.
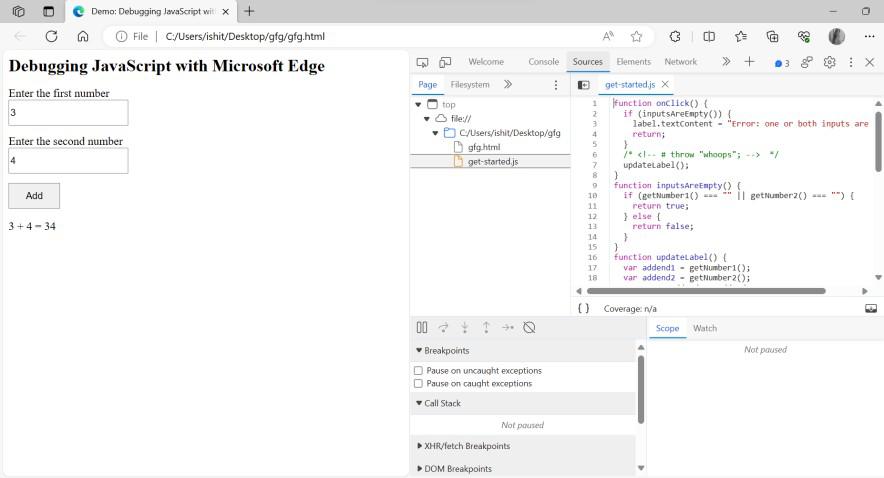
The contents of the file will now be visible in the editor pane, as you can see in the image above. The window at the bottom is called the debugger pane and it provides us with the tools to debug the JavaScript code.
Step 3: Use a breakpoint to pause the code:
- Now coming to the actual part i.e. debugging the code, we need to see where is the error. A common approach to find error is marking breakpoints. It is an alternative for console.log() statement but a little less time consuming than that.
- So, let’s apply breakpoints to our code and check where is the error. As shown in the image above, our output is displayed when the button is clicked. his tells us about the occurrence of an event. Hence, we will make use of an event listener breakpoint.
To apply it, in the debugger tab:
- Scroll a little and click on Event listener breakpoints.
- Then right click on “mouse” as this event is happening on mouse click.
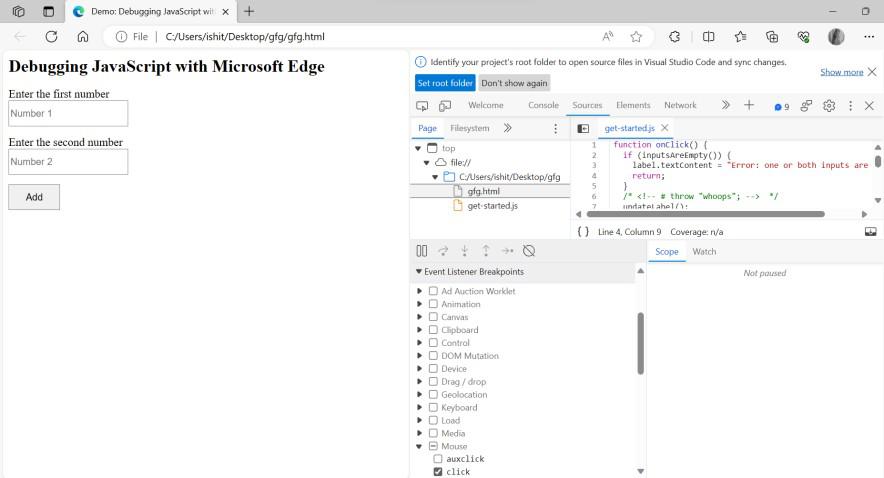
- Now, tick the checkbox “click”. By doing this, your dev tools will automatically pause whenever any mouse click will happen.
- Now when you’ll rerun the code and click on ADD button, your code will auto pause as soon as the mouse click happens.
Step 4: Step through the code:
Stepping through your code allows you to walk through the runtime of your code and hence helps you understand it better.
- Click Step over next function call. DevTools will run the following code without stepping into it.
- On the Sources tool of DevTools, click Step into next function call to step through the runtime of the updateLabel() function, one line at a time.
Step 5: Setting a line-of-code breakpoint:
Line-of-code breakpoints are another common types of breakpoints applied at specific line of code where one wants to pause.
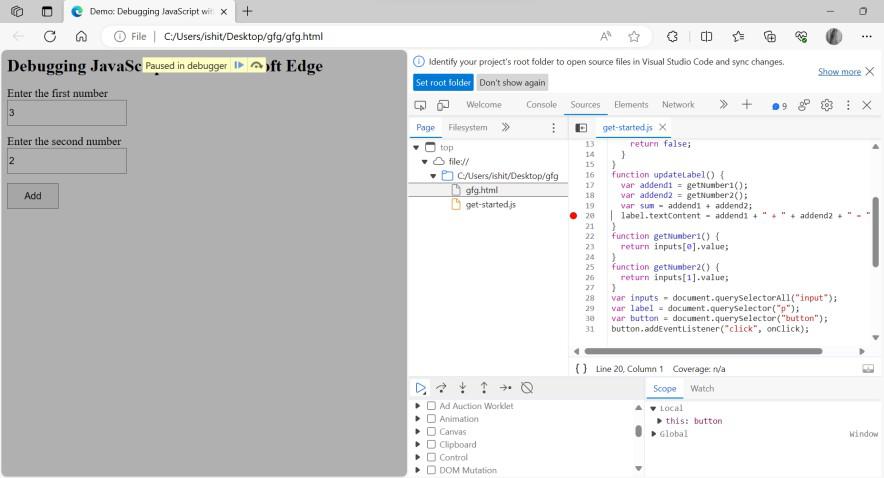
As you can see in the screenshot above, at line number 20 there is a red circle next to the code. This indicates the line of code breakpoint. Devtools will always pause before this line of code as it could be seen above.
When you’ll click on Resume script execution, the play button in the debugger pane, then only the code will resume.
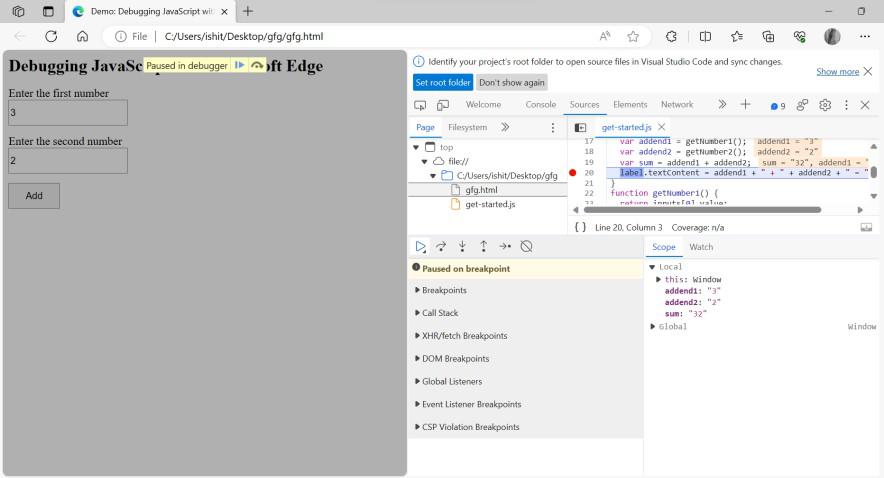
The values of the variables at that point could be seen at the bottom right pane, as shown in the image above.
Step 6: Check variable values:
Now, the values of variables returned in the above step doesn’t seem correct. On looking at the code, we see the numbers are written in quotes(” “) which raises a possibility that the numbers are being treated as a string. We could try getting more info about these variables.
To do so, click on the watch tab, select “+” button and type “typeof sum” to know the type of variable and it will return its datatype as shown.
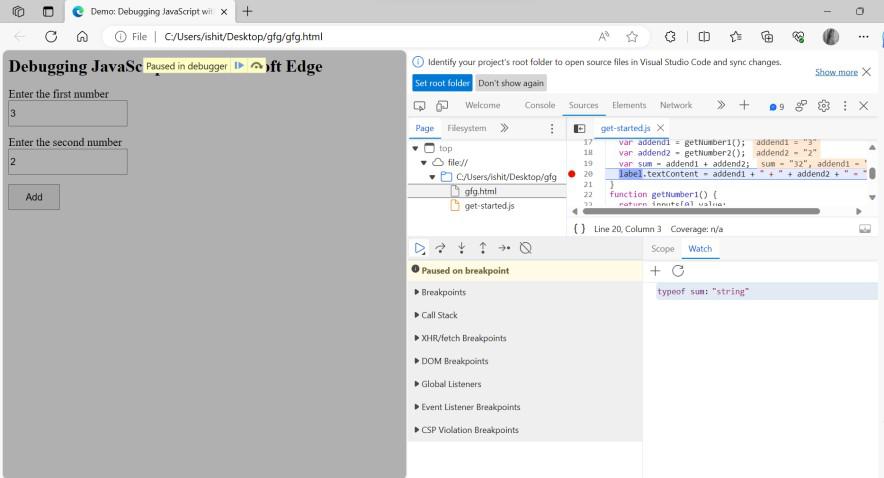
Now, we are able to recognize our error and we need to fix it.
Step 7: Fix the code
Coming to the last step, we need numbers to parse as integer, so we will replace line 19 with “var sum = parseInt(addend1) + parseInt(addend2);” in the editor pane. This way you can correct your code with the help of Devtools.
Remove the breakpoints and then run the code.
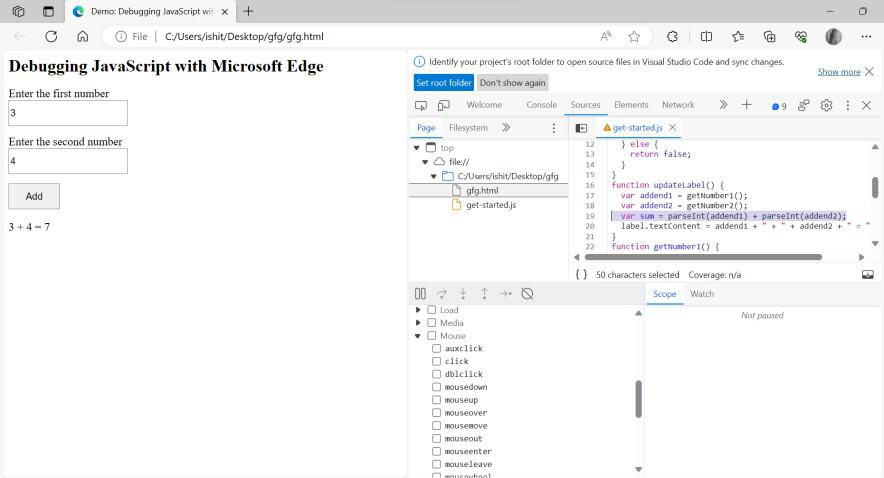
Now you have corrected the code successfully. Make sure you are fixing your original code as well after testing it in the editor pan as it won’t last once you refresh your page.
Share your thoughts in the comments
Please Login to comment...