Convert MultiDiGraph to GeoDataFrame Using OSMnx Utils_graph Module
Last Updated :
20 Mar, 2024
GeoDataFrame extends the functionality of pandas to deal with spatial data. They have special features and functions that are useful in Geographic Information Systems (GIS). In this article, we will see how we can convert MultiDiGraph to GeoDataFrame using OSMnx module.
Syntax of osmnx.utils_graph.graph_to_gdfs() Function
OSMnx utils_graph module (graph_to_gdfs) facilitates the conversion of MultiDiGraph (node/edge) to GeoDataFrames. The OSMnx functionality is as follows:
osmnx.utils_graph.graph_to_gdfs(G, nodes=True, edges=True, node_geometry=True, fill_edge_geometry=True)
Parameters
- G (networkx.MultiDiGraph) – input graph
- nodes (bool) – if True, convert graph nodes to a GeoDataFrame and return it
- edges (bool) – if True, convert graph edges to a GeoDataFrame and return it
- node_geometry (bool) – if True, create a geometry column from node x and y attributes
- fill_edge_geometry (bool) – if True, fill in missing edge geometry fields using nodes u and v
Returns
gdf_nodes or gdf_edges or tuple of (gdf_nodes, gdf_edges). gdf_nodes is indexed by osmid and gdf_edges is multi-indexed by u, v, key following normal MultiDiGraph structure.
Return Type
geopandas.GeoDataFrame or tuple
Getting Sample MultiDiGraph
Now let’s get into the implementation. Here we need an input graph, which is of type MultiDiGraph. We can get it by giving the address to osmnx module, graph_from_place. The code is shown below.
Python3
import osmnx as ox

multi_digraph = ox.graph_from_place('Modena, Italy')
multi_digraph
Output
<networkx.classes.multidigraph.MultiDiGraph at 0x178933df040>
We can get a better idea by plotting it.
Python3
ox.plot_graph(multi_digraph)
Output
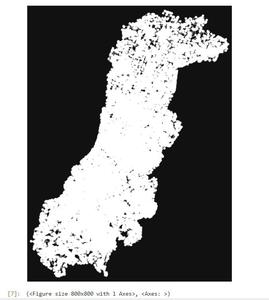
plot multidigraph
Fetch the nodes
Python3
Output
NodeView((60718257, 60718342, 60718350, 60718497, 60718657, 60718674, 60718691, 60718698, 60718705, 60718711, 60718717, 60718718, 60718740, 60718759, 60718778, 60718794, 82553388, 82553402, 82553405, 82553406, 82553410, 82553411, 82553416, 82553434, …… ))
Fetch the edges
Python3
Output
OutMultiEdgeView([(60718257, 60718350, 0), (60718257, 1786966488, 0), (60718342, 7048889484, 0), (60718342, 60718350, 0), (60718342, 8853584243, 0), (60718350, 60718257, 0), (60718350, 1786966480, 0), (60718350, 60718342, 0), (60718497, 60718794, 0), ….])
Convert MultiDiGraph to GeoDataFrame Using OSMnx utils_graph Module
Now you have a basic idea about the generated MultiDigraph. It’s time to make use of OSMnx functionality to convert multidigraph to geodataframe. We can extract nodes, edges or both as geodataframe using the graph_to_gdfs functionality. Let’s convert both nodes and edges together. The code as follows:
Python3
import osmnx as ox

# fetch nodes and edges as geodataframe

geo_dataframe = ox.utils_graph.graph_to_gdfs(
    multi_digraph, nodes=True, edges=True,
    node_geometry=False, fill_edge_geometry=False)

# print geodataframe in notebook
geo_dataframe
Output
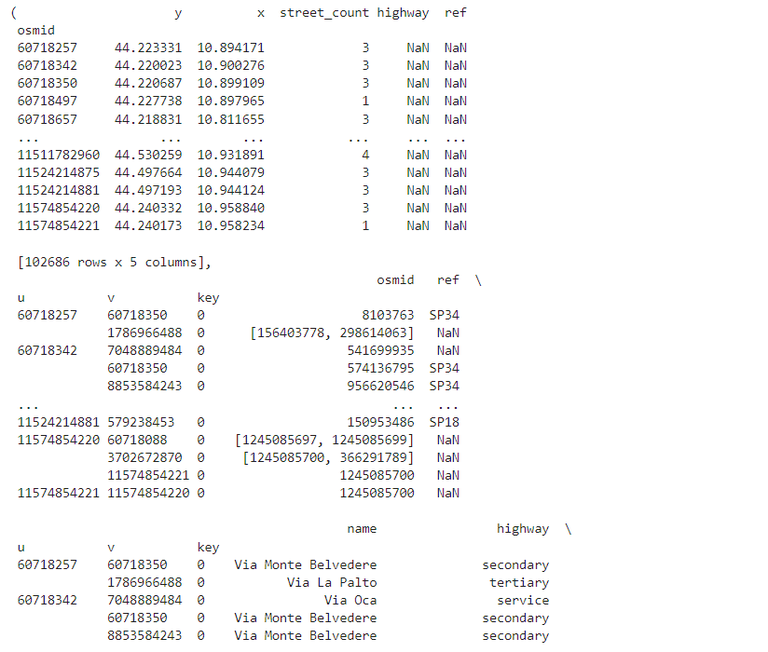
Geodataframe (nodes and edges)
In the above example, we fetched both nodes and edges by setting the required params as True (nodes and edges). The below code extracts nodes and its corresponding geometry.
Python3
# fetch nodes with geometry
geo_dataframe_node = ox.utils_graph.graph_to_gdfs(
    multi_digraph, nodes=True, edges=False, node_geometry=True,
    fill_edge_geometry=False)

# print in jupyter notebook
geo_dataframe_node
Output
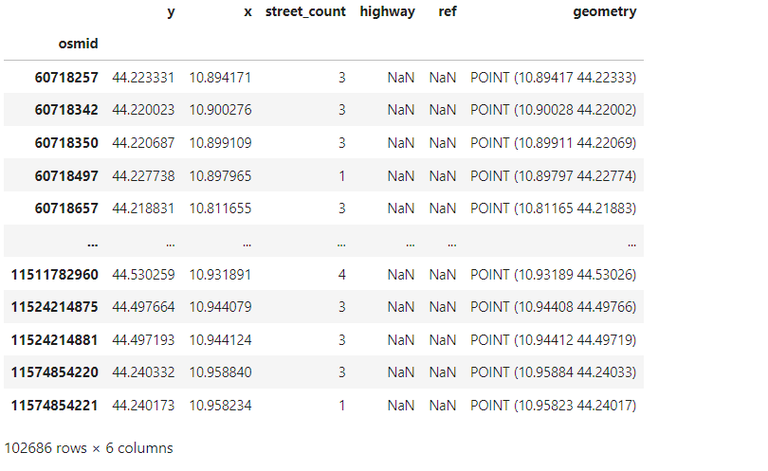
Geodataframe – Nodes with geometry
As a next step we extract edges as geodataframe, by setting edge parameter as True.
Python3
# convert edges to geodataframe
geodf_edge = ox.utils_graph.graph_to_gdfs(
    multi_digraph, nodes=False, edges=True, node_geometry=False,
    fill_edge_geometry=True)
Output
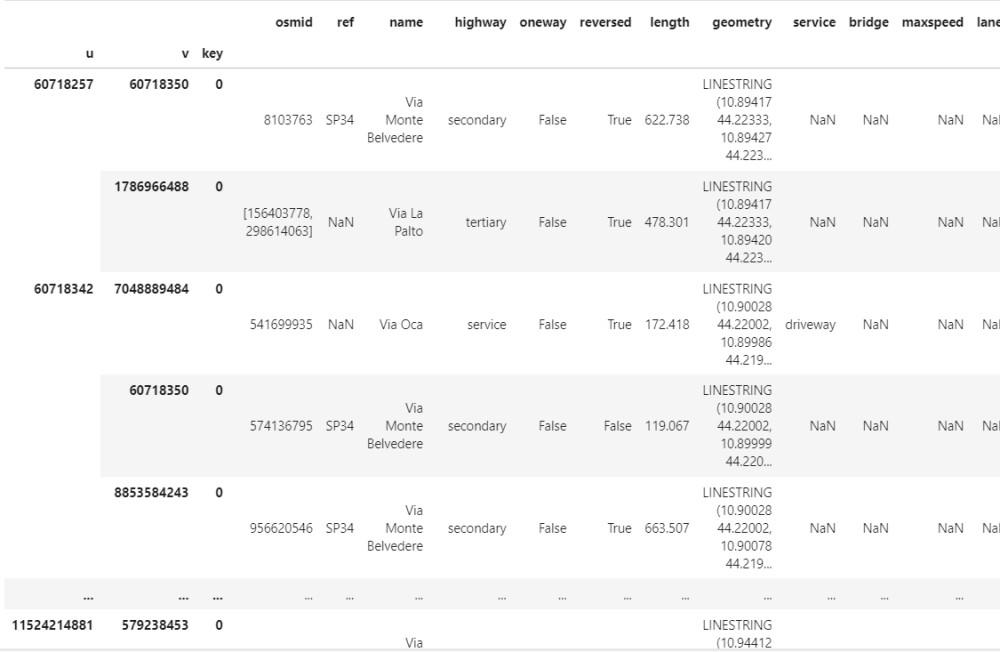
Edges as Geodataframe
Let’s check the type of the generated output
Python3
Output
geopandas.geodataframe.GeoDataFrame
We can review the generated geodataframe edges in map using geopandas.
Python3
# project it in map
geodf_edge.explore()
Output
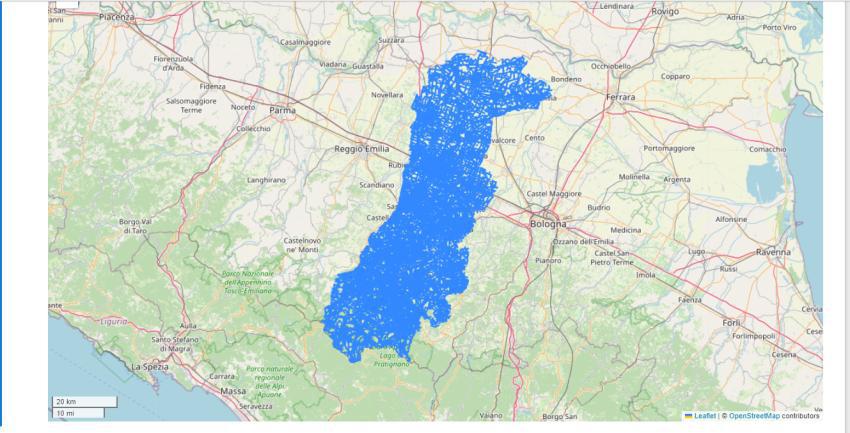
geodataframe in a map
Share your thoughts in the comments
Please Login to comment...