Contextual Outliers
Last Updated :
27 Oct, 2023
Understanding contextual outliers is essential across various fields, including statistics, finance, and anomaly detection, as they offer valuable insights into unique events or conditions that impact the data. By identifying and analyzing these outliers, we gain a deeper understanding of the nuances within our datasets, enabling us to make more informed decisions and draw meaningful conclusions within specific contexts.
This article explores the fascinating world of contextual outliers, shedding light on their significance and how they differ from global outliers. We’ll illustrate the concept with real-world examples, demonstrating how contextual outliers emerge when certain conditions or events come into play.
What are outliers?
Outliers are basically data points in the dataset that significantly differ from the majority of the data. For example, if the majority of the data is lying in the range of 1–50 and one or two points are lying at 125–150, then these points are termed outliers. These are the values that are exceptionally high or low in comparison to the other data points, which leads to distortions in the overall statistical analysis and interpretation of the data. It cannot be termed noise or error.
Outliers may result from various factors, including errors in data collection, measurement errors, or genuine variations in the data.
It can be identified through statistical techniques or visual methods, such as box plots, scatter plots, or the use of various outlier detection algorithms. Depending on the context and the cause of the outliers, they can be treated in different ways, including removal, transformation, or separate analysis to understand their potential impact on the dataset and the research or analysis being conducted.
Outliers are of three types, namely:
- Global outliers are data points that significantly deviate from the rest of the data in a dataset, irrespective of any specific conditions or contexts.
- Multivariate outliers are data points that are outliers when considering multiple attributes or dimensions simultaneously.
- Contextual outliers
Let’s dive deep into contextual outliers, also known as conditional outliers.
Contextual outliers
These are the outlier that is identified within a specific context or condition. In other words, the data point which may not be considered an outlier normally, but when we take into account the domain knowledge they become outliers. They are often analyzed in situations where the data varies based on different factors or attributes.
Here are some examples of contextual outliers:
- Temperature Anomaly: Imagine you’re monitoring the daily temperature in a city for a year. Most of the time, the temperature falls within a certain range. However, if there’s a day in the summer when the temperature suddenly drops significantly, that day’s temperature would be a contextual outlier because it deviates from the expected temperature for that season.
- Stock Market Fluctuations: In the stock market, the daily price of a stable stock may not be considered an outlier if it remains within a certain range. However, if a stock experiences a sudden and sharp price increase or decrease during a specific news event or earnings report, that day’s price change might be considered a contextual outlier within the context of that event.
- Website Traffic: A website usually has a fairly consistent number of daily visitors. However, during a major event, such as a product launch or a viral social media post, the website’s daily traffic might spike significantly. The days with high traffic would be contextual outliers within the context of normal daily traffic.
- Retail Sales: In a retail store, certain products may have steady sales figures throughout the year. However, during a holiday season or a special promotion, the sales of those products may increase substantially, making those sales periods contextual outliers in terms of sales volume.
- Hospital Admissions: In a hospital, the number of daily patient admissions typically follows a pattern. However, during a disease outbreak or a natural disaster, the hospital may experience a sudden surge in patient admissions, making those days contextual outliers in terms of hospital utilization.
Identifying and analyzing contextual outliers is important in various fields, such as statistics, finance, and anomaly detection, as they can provide valuable insights into unique events or conditions that affect the data.
Difference between Global and Contextual outlier
Global Outlier
- Datapoint that deviates significantly from the majority of the data.
- Global outliers are often detected using statistical methods like the z-score or the interquartile range (IQR) and are based on the distribution of the entire dataset.
- It can significantly skew summary statistics and have a more pronounced impact on overall data analysis.
Let’s take an example to understand the difference better.
Suppose you have a dataset of quiz scores for a class, and most students score between 70 and 75. If there is a student who scores 95 on one of the exams, this score is a global outlier because it is unusually high compared to the overall range of scores in the dataset.
Python3
import pandas as pd
import matplotlib.pyplot as plt
data = {'Student' : ['Alice', 'Bob', 'Charlie', 'David', 'Eve', 'Frank', 'Grace'],
'Math_Score' : [70, 75, 72, 70, 95, 73, 71]
}
contextual_outlier_index = 4
plt.plot(data['Student'],data['Math_Score'], marker="o")
plt.plot(data['Student'][contextual_outlier_index], data['Math_Score'][contextual_outlier_index], color = 'red', marker='*', label = "Outlier")
plt.xlabel('Name of Students')
plt.ylabel('Marks scored in Mathematics')
plt.title('Class Score in Quiz 6')
plt.legend()
plt.grid()
plt.show()
|
Output:

Scores of the class in Quiz 6, where the score of Eve is an Global Outlier
Contextual outlier
- Datapoints that deviates from the norm when specific conditions or context is taken into account.
- These are detected by first defining the relevant context or condition within which they are outliers. Then, outlier detection techniques are applied within that context to identify data points that deviate significantly from the norm within that subset.
- It provides valuable insight when analyzing under certain conditions.
Example:
Python3
import pandas as pd
import random
import numpy as np
from datetime import datetime, timedelta
import matplotlib.pyplot as plt
random_data = {
'Date': [datetime(2023, 1, 1) + timedelta(days=i) for i in range(30)],
'Temperature': np.sort([round(random.uniform(-10.0, 40.0), 1) for _ in range(30)]
)
}
data = pd.DataFrame(random_data)
contextual_outlier_index = data['Temperature'] > 30
data['Date'] = data['Date'].dt.strftime('%d-%b')
plt.plot(data['Date'], data['Temperature'], marker="o")
plt.plot(data['Date'][contextual_outlier_index],
data['Temperature'][contextual_outlier_index],
'ro-', label="Contextual Outliers\nIn January temperature is always < 30")
plt.xlabel('Date')
plt.ylabel('Temperature')
plt.title('Contextual Outliers')
plt.legend()
plt.xticks(rotation=90)
plt.show()
|
Output:
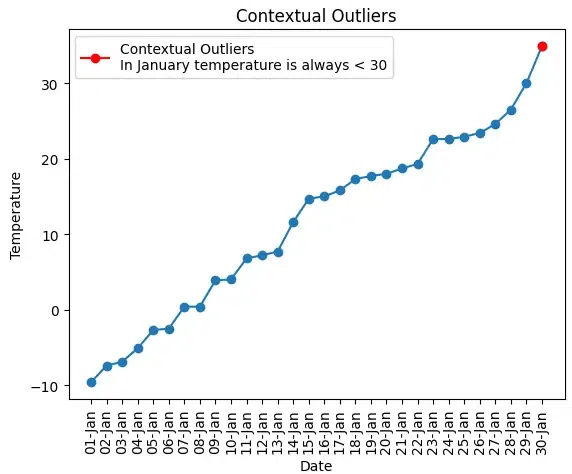
Contextual Outliers
Detecting contextual outliers typically involves defining the relevant conditions or contexts and then applying outlier detection techniques within those specific subsets of the data. The choice of contextual factors and the methods for identifying and handling contextual outliers will depend on the nature of the data and the goals of the analysis.
Share your thoughts in the comments
Please Login to comment...