Compute the Value of Poisson Quantile Function in R Programming – qpois() Function
Last Updated :
25 Jun, 2020
qpois() function in R Language is used to compute the value of Poisson Quantile Function. It creates a quantile density plot for poisson distribution.
Syntax: qpois(vec, lambda)
Parameters:
vec: Sequence of integer values
lambda: Average number of events per interval
Example 1:
x <- seq(0, 1, by = .01)
y <- qpois(x, lambda = 5)
y
|
Output:
  [1]   0   1   1   1   1   2   2   2   2   2   2   2   2   3   3   3   3   3
 [19]   3   3   3   3   3   3   3   3   3   4   4   4   4   4   4   4   4   4
 [37]   4   4   4   4   4   4   4   4   4   5   5   5   5   5   5   5   5   5
 [55]   5   5   5   5   5   5   5   5   6   6   6   6   6   6   6   6   6   6
 [73]   6   6   6   6   6   7   7   7   7   7   7   7   7   7   7   8   8   8
 [91]   8   8   8   8   9   9   9  10  10  11 Inf
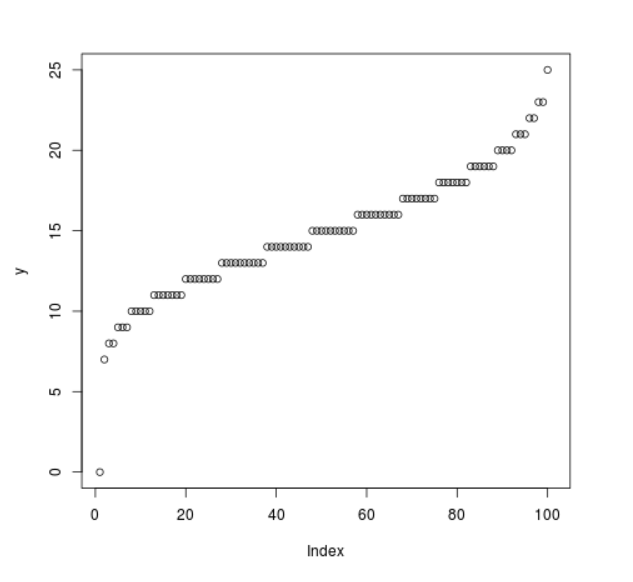
Example 2:
x <- seq(0, 1, by = 0.01)
y <- qpois(x, lambda = 15)
plot(y)
|
Output:
Share your thoughts in the comments
Please Login to comment...