Chart.js Configuration
Last Updated :
18 Dec, 2023
Chart.js Configuration is used to change the behavior and display of the chart according to the properties. There are many properties to change the display style, font, size, labels, and so on. The type, data, options, and plugin are required parameters for the chart.js configuration. The option and plugin are used to get attractive charts and other features.
Chart.js Configuration
- Configuration object structure: It provides the top-level structure of Chart.js Configuration.
- Global Configuration: The Global configuration is set to the nearest value to override the chart dataset. for all values. It is avoiding to set the configuration for single data. This configuration is used to create a responsive chart and its dataset using Char.js configuration. the global configuration uses index mode to display data in an index format for the responsive device.
- Dataset Configuration: The dataset configuration is set to the dataset or data style tag with a Boolean value. The dataset configuration is able to hide the line of the line graph using a false value.
Example 1: The example is set the bar type with font style and font type with the responsive chart.
HTML
<!DOCTYPE html>
<html lang="en">
<head>
<meta charset="UTF-8" />
<meta name="viewport"
content="width=device-width, initial-scale=1" />
<title>chart.js</title>
</head>
<body>
<h1> Geeks For Geeks </h1>
<h3> Chart.js Configuration </h3>
<canvas id="chartId" aria-label="chart"
heigth="500" width="500"></canvas>
<script src=
</script>
<script src=
</script>
<script>
let chartId = new Chart($("#chartId"), {
type: 'bar',
data: {
labels: ["Monday", "Tuesday", "Wednesday",
"Thursday", "Friday", "Saturday"],
datasets: [{
label: "DataSet",
data: [20, 40, 45, 35, 25, 30],
backgroundColor: ['orange', 'lightblue', 'aqua',
'pink', 'lightgreen', 'yellow'],
borderWidth: 3,
}],
},
options: {
responsive: true,
layout: {
padding: {
left: 30,
right: 30,
}
},
plugins: {
legend: {
labels: {
font: {
size: 20,
family: 'Helvetica',
style: 'bold',
}
}
}
}
},
});
</script>
</body>
</html>
|
Output:
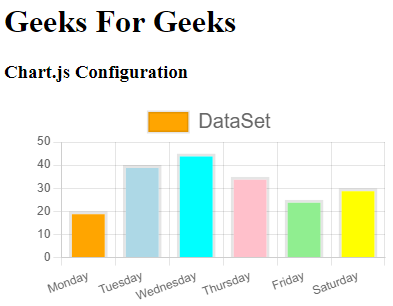
Basic Chart.js Configuration
Example 2: The basic example shows the chart with the global configuration. we can use the type, data, options, and plugin for the display chart eye catchy and attractive. the chart and data are required for the chart and option and plugin are used to change the chart features. the Dataset configuration helps to display and remove line of the chart using true or false value
HTML
<!DOCTYPE html>
<html lang="en">
<head>
<meta charset="UTF-8" />
<meta name="viewport"
content="width=device-width, initial-scale=1" />
<title>chart.js</title>
</head>
<body>
<h1> Geeks For Geeks </h1>
<h3> Chart.js Configuration </h3>
<canvas id="chartId" aria-label="chart"
heigth="500" width="500"></canvas>
<script src=
</script>
<script src=
</script>
<script>
// Char.js dataset configuration
Chart.defaults.datasets.line.showLine = false;
let chartId = new Chart($("#chartId"), {
type: 'line',
data: {
labels: ["Monday", "Tuesday", "Wednesday",
"Thursday", "Friday", "Saturday"],
datasets: [{
label: "DataSet",
data: [20, 40, 30, 45, 35, 25],
backgroundColor: ['orange', 'aqua', 'pink',
'lightgreen', 'lightblue', 'yellow'],
borderWidth: 3,
pointRadius: 5,
}],
},
options: {
responsive: false,
layout: {
padding: {
left: 30,
right: 30,
}
},
plugins: {
legend: {
labels: {
font: {
size: 20,
family: 'Helvetica',
style: 'bold',
}
}
}
}
},
});
</script>
</body>
</html>
|
Output:

Dataset chart.js configuration
Share your thoughts in the comments
Please Login to comment...