How to hide legend with Plotly Express and Plotly in Python?
Last Updated :
19 Dec, 2021
In this article, we will learn How to hide legend with Plotly Express and Plotly. Here we will discuss two different methods for hiding legend in plotly and plotly express, using two different examples for each to make it more clear.
Syntax: For legend:
- fig.update_traces(showlegend=False)
- fig.update(layout_showlegend=False)
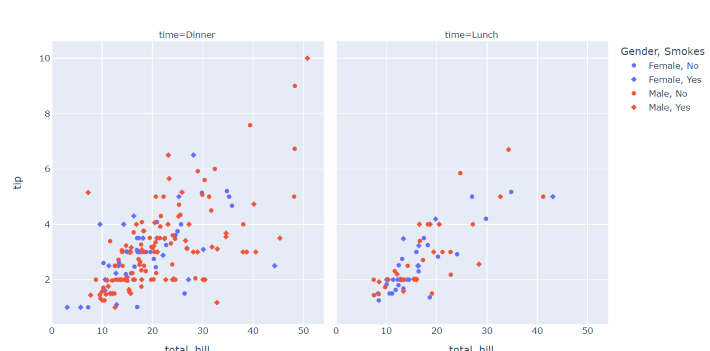
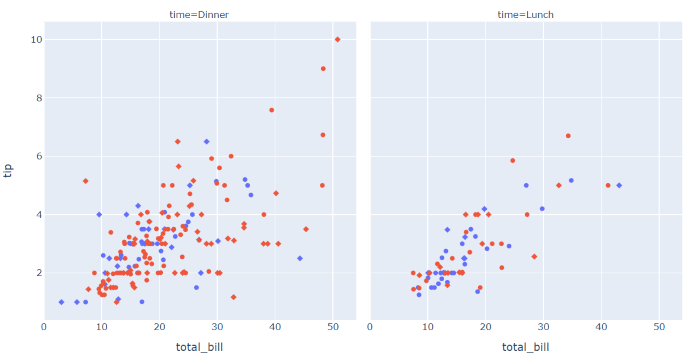
Example 1:
In this example, we are hiding legend in Plotly Express with the help of method fig.update_traces(showlegend=False), bypassing the show legend parameter as False.
Python3
import plotly.express as px
df = px.data.tips()
fig = px.scatter(df, x="total_bill", y="tip", color="sex",
symbol="smoker", facet_col="time",
labels={"sex": "Gender", "smoker": "Smokes"})
fig.update_traces(showlegend=False)
fig.show()
|
Output:
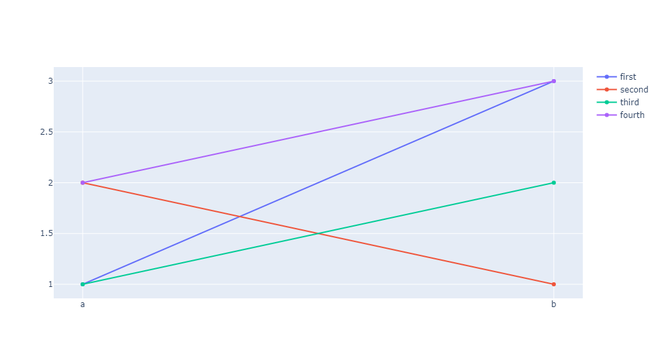
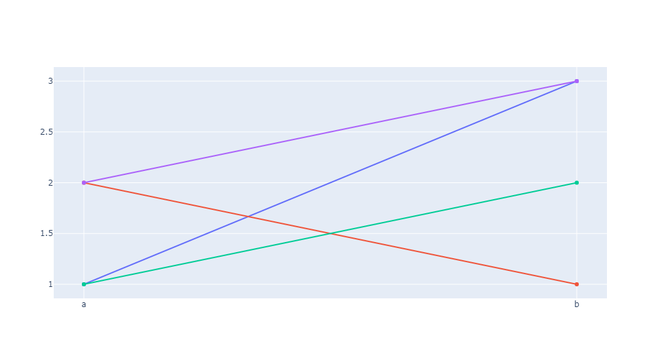
Example 2:
In this example, we are hiding legend in Plotly with the help of method fig.update(layout_showlegend=False), by passing the showlegend parameter as False.
Python3
import plotly.graph_objects as go
fig = go.Figure()
fig.add_trace(go.Line(name="first", x=["a", "b"], y=[1,3]))
fig.add_trace(go.Line(name="second", x=["a", "b"], y=[2,1]))
fig.add_trace(go.Line(name="third", x=["a", "b"], y=[1,2]))
fig.add_trace(go.Line(name="fourth", x=["a", "b"], y=[2,3]))
fig.update(layout_showlegend=False)
fig.show()
|
Output:
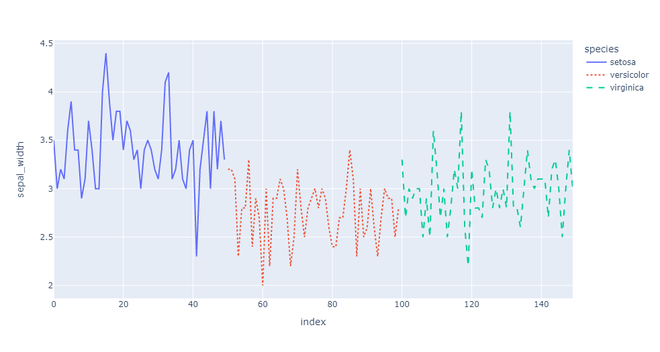
Example 3:
In this example, we are hiding legend in Plotly Express with the help of method fig.update_traces(showlegend=False), by passing the layout_showlegend parameter as False.
Python3
import plotly.express as px
df = px.data.iris()
fig = px.line(df, y="sepal_width", line_dash='species',
color='species')
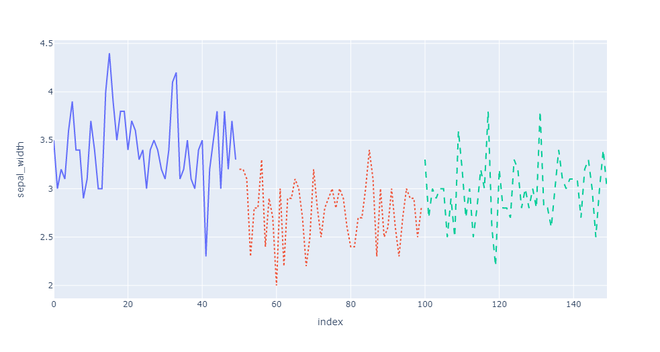
fig.update_traces(showlegend=False)
fig.show()
|
Output:
Share your thoughts in the comments
Please Login to comment...