Hide legend in plotly express in Python?
Last Updated :
22 Nov, 2021
In this article, we will discuss how to hide legend in plotly express using Python.
Dataset in use: bestsellers4
The legend appears by default when variation in one object has to be depicted with reference to the other. Legend makes it easier to read a graph since it contains descriptions for the color code or keys used.
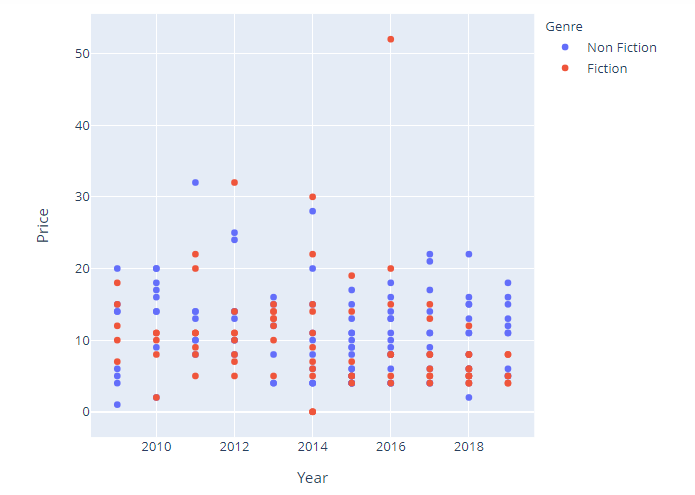
Creating a regular plot so that the difference can be apparent
Here we are going to create a scatter plot using dataframe. For this, we will create dataframe from a given dataset.
Python3
import plotly.express as px
import pandas as pd
data = pd.read_csv("bestsellers.csv")
fig = px.scatter(data, x="Year", y="Price",
color="Genre")
fig.show()
|
Output:

Hide legend in plotly express
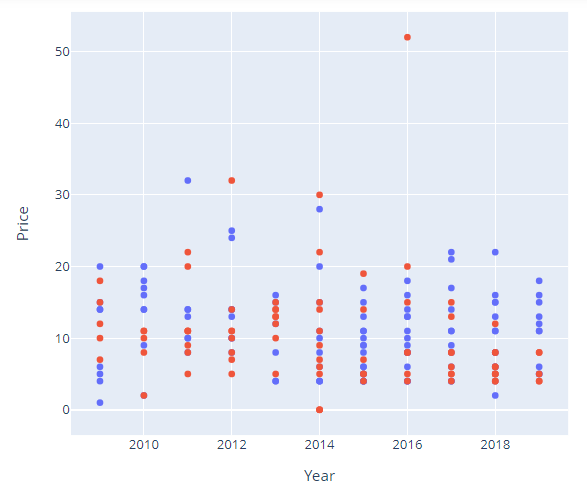
Now, to hide the legend, update_layout() function is called with showlegend argument set to false. This simple statement is enough to get the job done.
Syntax:
update_layout(showlegend=false)
Python3
import plotly.express as px
import pandas as pd
data = pd.read_csv("bestsellers.csv")
fig = px.scatter(data, x="Year", y="Price",
color="Genre")
fig.update_layout(showlegend = False)
fig.show()
|
Output:

Like Article
Suggest improvement
Share your thoughts in the comments
Please Login to comment...